

 Print
Print Brad here. Today, we have a look at the Fed’s recent move into the cash markets from Nicholas Follett, manager of fixed income on our Investment Management and Research team. Enjoy!
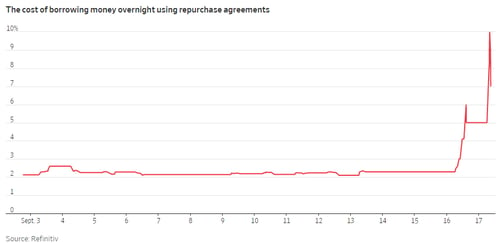
You may have heard that the repo rate jumped 7 percent at the start of the day on Monday. You probably also saw that the Fed responded by stepping into the cash market for the first time since 2008. But unless you’re one of the few people who follows and understands the cash rates, you may be asking yourself what any of this means—and whether this could be the beginning of the end.
It’s not. But before I explain why, let’s take a closer look at what happened.
The repo rate
The market for repurchase agreements (known as repos) exists so parties with significant assets but insufficient cash (e.g., financial institutions) can cheaply borrow from a lender for a very limited time. In practice, these parties are typically companies gaining overnight access to cash using U.S. Treasuries as collateral. At the end of the term, the borrower repurchases the Treasuries at a slightly higher price than loaned (hence, the name repo). The cash lenders are often money market funds and other asset managers looking to park cash on a very short time frame for marginal gain and minimal risk.
Why did the Fed step in?
The repo rate is very closely tied to the federal funds rate. Over the past two days, the repo rate has pushed the latter up to the absolute upper bound of its 2 percent to 2.25 percent range. Previously, it was at 2.14 percent. With the Fed poised to cut rates today to 1.75 percent to 2 percent, the New York Fed, which maintains open market operations for the larger system, announced yesterday that it will “conduct [a repo] . . . in order to help maintain the federal funds rate within the target range of 2 to 2-1/4 percent.” In reality, it bought $53.2 billion of securities to ameliorate the liquidity squeeze and suggested it will inject $75 billion again today. Basically, if the federal funds rate stays that high, the Fed will have a hard time cutting and lowering the band.
What does a spike in the repo market mean?
Now, this news all seems terrible. Usually, when there’s a spike in the repo market, it implies one of two things:
- A lack of confidence within the borrower/lender dynamic (credit crisis)
- A lack of liquidity (supply and demand disconnect)
Neither of these scenarios is positive, but a credit crisis is far worse. The good news is that there appears to be a technical glitch in the supply/demand dynamic. Surges in the repo rate typically occur at quarter-end and sometimes month-end when companies need to borrow cash to pay their debt. This midmonth jump has been attributed to a confluence of influences that knocked the cash reserves supply out of whack, specifically:
- Due to changes in regulations (specifically, to the Dodd-Frank Act), financial institutions, especially banks but broker/dealers too, have fewer liquid instruments on the books. To put it in perspective, prior to 2009, the repo market was as large as the Treasury market. Now, it’s only 23 percent of the size, so funding can get very tight very quickly when squeezes occur. Supply down.
- Last week’s bond market sell-off meant that the bonds financial institutions had were worth somewhat less. Supply down.
- The Fed has been shrinking the size of its balance sheet, which will also reduce the amount of excess bank reserves held at the Fed. Supply down.
- 2018 corporate taxes were due on September 15, creating a massive liquidity need. Demand way up.
The Fed stepped in because that’s its job: lender of last resort. In this case, the wording is a bit dramatic. Ultimately, the situation is the same: the Fed needed to inject liquidity into the system, and it did.
So, how bad is it?
Although this spike was nasty for those who were forced to borrow at such elevated levels, it doesn’t portend of an imminent financial crisis. It does suggest the Fed is starting to lose control over the short-term lending market, one of its key tools in conducting monetary policy. And with low marks on messaging, two of the Fed’s three main levers to pull are now in question. Further, it highlights Wall Street’s inability to absorb record sales of Treasuries to fund the greatly expanding U.S. budget deficit.
The technical imbalance shouldn’t last very long, but it’s still something to keep an eye on. It’s very possible that by the time you read this post, the entire situation will have blown over. But it’s imperative to be cognizant of such events and not get caught unawares if this is an actual event, which it may end up being.
I know this all sounds scary. For sure, we’re getting to a point in the economic cycle when there will be a credit crisis. But that point doesn’t appear to be now.


