

 Print
Print
One of the outcomes from the recent Fed meeting, where the Fed decided to raise rates for the first time in years, was a clear plan to continue to raise rates over the next year. Fed Chair Jerome Powell added fuel to the fire yesterday when he said that the Fed was willing to raise rates even faster than the meeting notes suggested. The Fed is now clearly focused on bringing inflation back down, even if it means slowing down the economy.
The Interest Rate Cycle
Markets have responded by bidding up interest rates around the world. Higher interest rates will slow the economy, of course, and, historically, they have also led to recession. Markets know this and account for it. As the Fed raises interest rates during shorter time periods, longer-term rates also go up—to a point. That point shifts as markets start expecting the higher rates to slow growth and cause a recession, which would cause the Fed to start cutting rates again. You can see this pattern emerge when looking at various rate levels over different time periods.
What’s interesting is that we can also use changes in interest rates to estimate when the next recession might be coming. The basic idea is that longer rates, in a growing economy, should be higher than shorter-term rates. Over a longer time period, more can go wrong, so interest rates are higher to compensate for that risk.
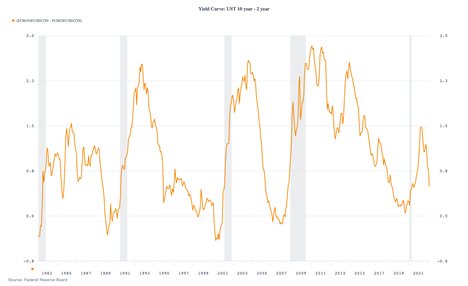
But it doesn’t always work that way. Sometimes, longer-term rates drop below shorter-term rates. This phenomenon is known as a yield-curve inversion, and we can use it as a recession indicator. The rates in question that are showing up in the headlines are for U.S. Treasury securities for 10-year and 2-year terms. If you subtract the two, you get the chart below.
The Connection Between the Yield Curve and Recession
As you can see, when the 2-year rate is above the 10-year rate, the line in the chart drops below zero. When that happens, we tend to get a recession within the next two to three years. In recent days, the drop has been sharp, as rates have climbed more in the short term than they have in the longer term. If this pattern continues, we could see an inversion in the next couple of weeks, which would likely signal a recession in the next couple of years.
But as you read that, note the qualifiers. If rates continue to shift—and they might not. If they shift enough to invert the curve—and they might not. And if both of those things happen, they might signal a recession sometime in the next one to three years. That's a lot of ifs. On the one hand, a recession might happen. On the other, it might not. How can we tell?
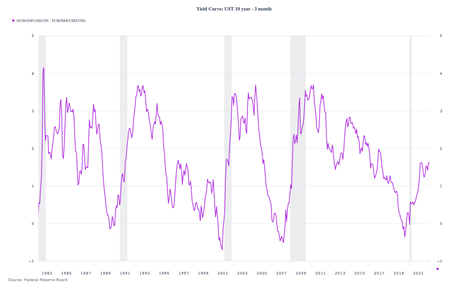
While the 10/2 curve is a good indicator and suggests that risks are rising, a better, timelier indicator looks at the 10-year and 3-month interest rates. By using the 3-month rate, we can isolate the short-term rate effect from the longer term.
The Recession Outlook? Low Risk
When we look at these records, we see that while the 10/2 curve is dropping down toward zero, the 10/3 curve is still positive. We also see that, historically, this curve has been a much timelier indicator, generally signaling a recession in the next year or so. In other words, the 10/2 curve is saying we might see a recession in the next two to three years. The 10/3 curve is showing we won’t see a recession in the next year. The risks over the next two to three years are real, but the risk of a recession in the next year remains low.
And that is the real takeaway here. The economy is certainly facing new stressors, such as lingering pandemic woes, inflation, and the Ukraine war. But we continue to see strong employment growth, reasonable confidence and spending figures, and solid business investment. The economy has a lot of momentum, enough to keep us going for at least another year. And in that year, a lot can happen.


