 I left off last week with a discussion of the Federal Reserve’s interest rate policy and inflation. As I noted, the Fed may well be forced to raise rates faster than the market is now pricing in, as inflation increases.
Whether that happens or not really depends on what you mean by inflation. There are literally dozens of measures available, but today I want to focus on three:
- The Consumer Price Index (CPI)
- The core CPI, and
- Personal consumption expenditures (PCE), which the Fed is said to weight most heavily
CPI
The CPI measures the rising prices of pretty much everything the average person buys—housing, cars, food, gas and utilities, clothing, and so on. The Bureau of Labor Statistics collects data on about 80,000 items, every month, to calculate how much prices are increasing.
Is it perfect? Of course not. The CPI doesn’t necessarily reflect the actual price changes anyone sees, because the weightings don’t match how many people spend. On the other hand, it is a reasonable and consistent indicator, and one that coincides with real-time services such as MIT’s Billion Prices Project.
One of its weaknesses is that items such as food and energy, which are extremely variable, can skew the numbers, as we’ve seen recently with the drop in the price of gas. What’s more, these categories don’t really depend on the economy itself, but rather on supply and demand characteristics outside the economy.
Core CPI
A more reliable measure, core CPI, excludes food and energy from the calculation. It’s not that economists don’t eat or drive, but because these categories bounce around so much before eventually normalizing, core CPI is often more useful.

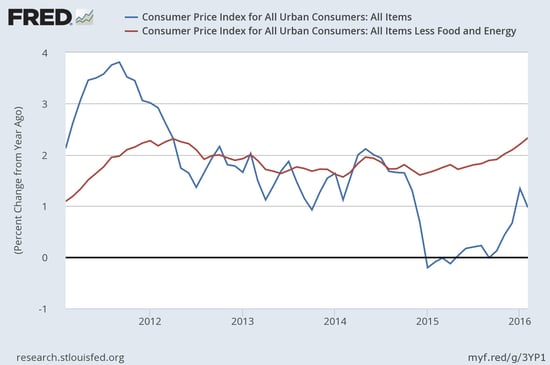
Looking at the chart above, you can see how variable CPI (the blue line) is, as well as the recent drop-off in 2015 as oil prices plunged. Core CPI (the red line) is much more consistent and therefore a better policy guide.
Note, however, that both CPI and core CPI are increasing. The increase in CPI largely reflects an increase in oil prices (or, more precisely, an end to decreases on an annual basis) and can be expected to continue. Core CPI is also increasing, albeit more modestly, rising to the highest level in the past five years and seemingly picking up speed.
These trends are why I believe the Fed may be forced to act faster than it now thinks. With inflation targeted at 2 percent, core is already above that and rising fast. Even CPI itself should reach that level fairly soon, as low oil prices roll off the annual comparisons.
PCE
The Fed’s worry about low inflation is largely due to the primary measure it uses, the PCE price index, which does indeed show continued low inflation. Because of the way this index is calculated, however, medical costs are based largely on government reimbursements, which have been limited and are running below the private-sector costs tracked in the CPI. This and other such factors have the PCE showing a lower level of inflation than the more commonly used measures.
As long as the Fed continues to focus on the PCE, it is less likely to act. But as the gap gets wider and the more publicized measures increasingly affect people’s decisions, the pressure on the Fed will build. This is not a today problem, but it will very likely be problem in a year or so. Expect to see faster rate increases in the medium term, as the Fed runs out of wriggle room.


 Print
Print

