

 Print
Print For all the hype around today’s inflation data and what it might mean for markets and the economy, the truth is simply this: not much news here.
Breaking Down the Numbers
Looking at the numbers, this conclusion becomes clear. Headline inflation, which includes energy and food, jumped from –0.1 percent to 0.5 percent on a monthly basis, as energy prices ticked back up. Here, the annual figure dropped slightly, from 6.5 percent to 6.4 percent. The core number, which excludes energy and food, ticked up from 0.3 percent to 0.4 percent on a monthly basis, but it dropped from 5.7 percent to 5.6 percent on an annual basis. In both cases, we saw monthly volatility, but the annual trend downward continued—which is what we have seen for the past several months.
The core numbers are better indicators of what is going on with the real economy, as energy prices can and do bounce around. So, let’s take a closer look there.
A Closer Look at the Core Data
This month’s core data was in line with expectations and remains at the lower end of the range we have seen since 2022. On a three-month average basis, core inflation is running at around 4 percent per year. This is, of course, not at the Fed’s 2 percent target, but it is still well below where we are now on an annual basis. The annual trend will continue down unless the monthly numbers spike back up.
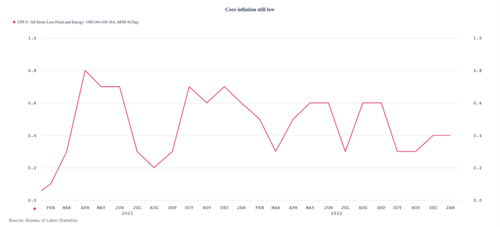
When we look at the details of the monthly reports, that spike looks unlikely. The swing this month is largely coming from goods, which were in deflation last month and swung to positive. This is something to watch. But with core goods at only 0.1 percent, now that the effects of the swing are accounted for, the future damage should be contained.
Downward Trend Likely to Continue
On top of that, in general, most of the remaining inflation is coming from the service sector, and most of that from shelter. The housing market has softened dramatically, and that component should be declining over the next several months. Other services (hotels up, medical care down, airfares down) are mixed. With non-shelter services inflation low and with shelter likely to roll over, the trend should keep going down.
Not Great, But Reassuring
The short version of this is that we did see inflation rise on a monthly basis. But that was simply a result of typical volatility in the data, and the trend remains unchanged. Lots to talk about, if you’re into that, but no real changes in the overall situation. This isn’t a great report, but it is a reassuring one in that the existing favorable trend continues overall.
Keep calm and carry on.


