

 Print
Print Brad here. One of the side effects of the recent stock market pullback, combined with the pandemic, has been an increase in the perceptions of risk—in everything. Recently, we have gotten a number of questions about an article that claimed we were headed for another financial crisis on top of everything else. It was a very scary article, but (spoiler alert!) as my colleague Nick Follett discusses below, it was overstated and, in many respects, just plain wrong in many of its assertions. This post is a bit more technical than we usually do here, but I think it is worth taking a deeper dive to understand what is really happening. Over to you, Nick!
Last week, an article was published in The Atlantic titled “The Looming Bank Collapse,” which suggested the U.S. financial system is on the cusp of calamity. Actually, that idea was the lede, rather than a mere suggestion. The premise of the pending demise was that banks had not learned their lesson from 2008 and were repeating the sins of the past. Back then, it was with mortgage-backed securities (MBSs); now, it’s with business loans. Because of that, not only will we have a systemic crash akin to the great financial crisis, but like every subsequent Sharknado movie, this one will be worse than the last. Let’s look at the thesis of the article and try to determine whether it’s plausible.
Baskets—and baskets of baskets
If MBSs were hundreds or thousands of individual mortgages repackaged and bundled together in a single wrapper, collateralized debt obligations (CDOs) were repackaged MBSs put into a single wrapper. So, if an MBS was a basket of mortgages, a CDO was a basket of baskets.
The concept of securitizing the assets allowed for risk to be reapplied to different tranches. Investors could pick which level of risk they could handle, with the commensurate yield associated. Even if defaults started to occur, each tier wouldn’t be negatively affected unless the preceding one was wiped out completely. At least that was the idea.
As we know, complex derivatives of these vehicles were created, and even the top tiers started cracking, with more than 13,000 of the highest-rated instruments defaulting. This was cataclysmic to the banking system, as CDOs were often held on balance sheets, and losses against loans (coupled with interbank counterparty risk) proved overwhelming to (formerly) blue chip lenders such as Bear Sterns and Lehman Brothers.
Collateralized loan obligations (CLOs) are corporate debts that have been securitized in the same way that mortgages were for MBSs or MBSs were for CDOs. The underlying securities in CLOs are bank loans, which I wrote about at length on this blog 18 months ago. The short version is that bank loans are typically issued by non-investment-grade companies and pay a yield based on a floating rate (LIBOR plus some extra credit compensation). They become more attractive to investors as yields increase. Conversely, when the Fed cut rates to zero in March, the yield required of the borrowers fell dramatically, making them less attractive to investors. Much like CDOs, CLOs have different risks and yields based on the select tranches. Also like CDOs, the upper echelon is held by banks on their balance sheets. So, in short, CDOs were baskets of baskets of mortgages (consumer debt), while CLOs are baskets of bank loans (corporate debt).
The worst-case scenario
The concern The Atlantic article addresses is simple: what if the worst-case scenario happens? We know that consumer spending has slowed. We also know that the issuers of bank loans are high-yield-rated companies. What if, like in 2008 when homeowners were no longer able to pay their mortgages, corporations could no longer pay their debt service? Taken to the extreme, the CLOs would start to unravel. Eventually, in the absolute worst-case scenario, billions of dollars on bank balance sheets would be wiped out and lead to the titular looming bank collapse. That’s an oversimplification—but not a huge one.
Could it happen?
Of course, it could happen. But the probability is extremely low. Yes, there are issues with bank loans. Specifically, in March, the lack of liquidity when even the most liquid vehicles were having difficulty finding a buyer caused a huge concern, and the lack of lender-friendly covenants provided little support to lenders. And yes, there are issues with CLOs. The underlying holdings (i.e., bank loans) have issues, so the wrapper has issues, in particular the opacity of seeing an “asset-backed security” in a mutual fund when it’s actually a bank loan. But for CLOs to have the same impact in 2020 as CDOs did in 2008? It doesn’t seem possible. Let’s look at some of the specifics mentioned in the article that I find problematic.
The underlying holdings. CDOs were about mortgages. When people lose their jobs, the first thing they do, historically, is stop paying their mortgages. Why? It’s very hard and expensive to kick someone out of a house. Homeowners pay their other bills (e.g., electric, water) for survival. They also pay the auto bill before a mortgage, as a car is typically necessary in day-to-day life.The mortgage payment spigot was shut off immediately before anything else in 2008, which is what contributed to the collapse of CDOs. But not all bank loans are bad. For the past several years, borrowers have been going to the loan market over the high-yield market because it’s often been cheaper. Corporations are still seeing cash flows. They’ve been diminished for sure, but they are cash flows nonetheless. And, given that the Fed dropped interest rates to zero, borrowers can refinance the debt at a fraction of the previous cost.
The structure. As CDOs were taken from MBSs, not mortgages, they were typically created from riskier parts of original MBSs, specifically subprime, and were set up to be unharmed if losses did not exceed 8 percent. On the other hand, they’d be wiped out if losses were greater than 11 percent. Losses in the subprime space averaged 40 percent, crushing many CDOs. CLOs are derived from bank loans themselves, and the leverage is simply the debt, rather than a re-securitization. The current default rate in loans is 3 percent, the third-highest in the past decade; however, much of the losses have already been priced in and have since rebounded. Loan prices bottomed at $76.2 (based on $100 loan) during March and rose to $89.1 at the end of May. There is still robust demand for any yield-producing vehicle given the low-rate environment, so the technical support is a tailwind.
The size. The amount of assets in each of the respective structures is simply incomparable. The CLO market was pegged at $675 billion by S&P at the beginning of the year. In 2008, the subprime market (including Alt-A mortgages) was about $2 trillion. In other words, the CLO market is one-third of the size. It doesn’t have the weight to bring the economy screeching to a halt.
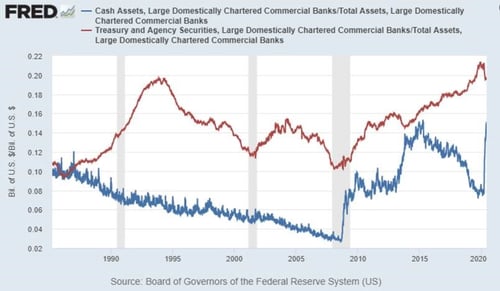
The banks themselves. The author of The Atlantic article (Frank Partnoy) makes a big deal about how his personal bank, Wells Fargo, is holding $29.7 billion in CLOs on its books. That’s a big, scary number. But let’s put it into context. Wells has more than $1.7 trillion in AUM, so the CLO exposure amounts to less than 2 percent. The concentration of CLO debt is mostly limited to three banks: Wells Fargo, JPMorgan Chase, and Citigroup, which account for 81 percent of U.S. bank CLO holdings in total. JPMorgan Chase has $35 billion in CLOs; however, its assets are $2.7 trillion, so its CLO holdings represent 1.3 percent. Citigroup has $15.3 billion on $1.95 trillion AUM. That’s less than 1 percent. They’re not loaded up on risky debt. In fact, it’s quite the opposite. Taken in aggregate, banks have the highest level of cash and Treasuries in modern history.
Look beyond the headlines
Given the heightened tension of everything that’s happening in the world, it’s completely understandable that whenever there’s an article like this one, it attracts quite a bit of attention. And as the numbers are astronomical, it seems like there are larger systemic issues afoot. But once you put the numbers together and look at the actual facts, the issue is far more benign. CLOs are something to watch, and in fact, we have been doing so for years now. But it seems very unlikely that they are to 2020 what CDOs were to 2008.


