

 Print
Print Brad here. Yesterday, I laid out why I am not concerned, in general, about what a yield curve inversion means for the economy, while still being very aware of the increasing risks. Today, Anu Gaggar is taking a more detailed look at what inversions have historically meant for the markets. Although she too sees rising risks, she is also less concerned in the short term—so let’s hope we are right!
The spread between the U.S. 2-year Treasury yield and the 10-year Treasury yield (2s10s spread) is getting precariously close to 0, and the likelihood of an inverted yield curve has increased. It is widely believed that an inverted yield curve is a precursor to a recession. Let’s explore what an inverted yield curve is, what it signals, and how to invest during an inversion.
Yield Curve Inversion Defined
The yield curve inverts when short-term interest rates are higher than longer-term rates. When that happens, you can get a higher interest rate on a six-month CD than, say, a five-year CD. This appears counterintuitive. Shouldn’t you get paid more for parting with your money for longer? But this happens when the bank is confident it can lend money for the short term but is expecting a likely slowdown in the economy and loan demand in the long term. As a result, it is willing to pay more for short-term deposits than for longer-term ones.
Markets are fixated on the U.S. Treasury yield curve as it is considered an excellent gauge of the economy. If the economy is healthy and growing, longer-term Treasury rates should be higher than shorter-term rates, as there is a positive time value or term premium for interest rates. When the reverse happens (i.e., short-term rates are higher than the long-term rates), concerns start to mount about the future state of the economy.
Why Is the Curve Flattening?
As shown in the chart below, the shape of the U.S. Treasury yield curve has changed substantially over the past year.
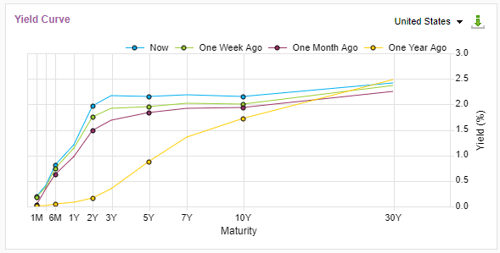
Source: FactSet
The widely monitored 2s10s spread has declined from a high of 1.56 percent in March 2021 to less than 0.2 percent in just under a year. There is consensus that the 2s10s spread will fall below 0 or the yield curve will invert soon. The Fed is on a quest to stem inflation by hiking short-term interest rates; hence, the market is pricing in a hawkish Fed at the short end of the curve. The longer-term rates have risen as well but haven’t kept pace, largely due to the following:
- There is demand for long-term Treasury paper from pension funds that need to match the duration of their liabilities with their assets. They are also looking to de-risk after a few strong years of returns from their equity holdings.
- U.S. Treasuries are a popular holding for global central banks, both because of the reserve status of the U.S. dollar and because U.S. Treasuries are trading at higher interest rates than government paper in most developed countries.
- The Fed was purchasing Treasuries up until the last Fed meeting in March, in order to pump liquidity into an economy recovering from the pandemic.
- With heightened geopolitical risks, U.S. Treasuries act as a safe haven for investors.
Greater demand for longer-dated U.S. Treasuries pushes up their prices and pushes down their yields. Thus, the short end of the curve is rising while the long end of the curve is unable to break free from the gravitational pull of the above forces.
What Will Happen to the Economy and Markets?
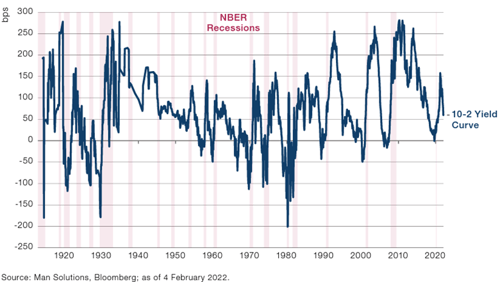
Yield curve flattening and, ultimately, inversion are features of an economy that is shifting gears from midcycle to late cycle. The market starts to price in rate hikes by the Fed as the recovery gathers steam during midcycle. In the late cycle, markets begin to fret that tighter monetary policy could take the wind out of the economy and a downturn might be approaching. It is widely believed that an inverted yield curve is a harbinger of recession. There have been 28 instances since 1900 where the yield curve has inverted; in 22 of these episodes, a recession has followed, including the fleeting intraday inversion in 2019 followed by the COVID-induced recession in 2020.
Time to Run for the Hills?
While yield curve inversion might be a reliable indicator of a recession on the horizon, it isn’t a very reliable market timing tool. The lag between curve inversion and the start of a recession has averaged about 22 months but has ranged from 6 to 36 months for the last six recessions. What’s more, even when the yield curve inverts, it’s a poor signal for getting out of risk assets such as equities. Late cycle is not the same as end of cycle, and equities may continue to offer positive returns. In the six episodes of yield curve inversion since 1975, global equities have, in aggregate, risen in the 12-month period after the inversion. Under the surface, there are shifts in leadership—and that’s what is key for how to invest in the period after the inversion.
Pick Your Spots
While equities have risen after the yield curve inversion, returns have generally been weaker than the pre-inversion period. Defensive sectors have typically outperformed cyclical sectors in the 12-month succeeding the 2s10s inversion. This should make intuitive sense: if we are nearing late cycle, equities are likely expensive, corporate earnings have peaked, and the Fed is raising rates—all factors that can dampen equity returns. With an economy in late cycle, fears of impending slowdown make defensive sectors relatively more attractive. Thus, for an equity investor, it is imperative to pick your spots carefully. This may not be the time to go over your skis to accept risks. While a paring back of equities may not be necessary, a defensive relative positioning going into a possible slowdown may help investors ride the wave.


