

 Print
Print I have always rather disliked the saying, “What gets measured gets managed.” On one hand, it is a truism. On the other hand, it is misleading in many ways. Today’s issue, inflation, is a great example. How we manage it depends very closely on how we measure it, which is quite true. But it begs the question as to how we should measure it. I might rephrase the saying, in this case, as, “What gets appropriately measured gets effectively managed.” This phrasing still has issues but is much closer to what we actually need to do. Beyond this, we start to get into pedantry, if we are not already there.
Back to Economics
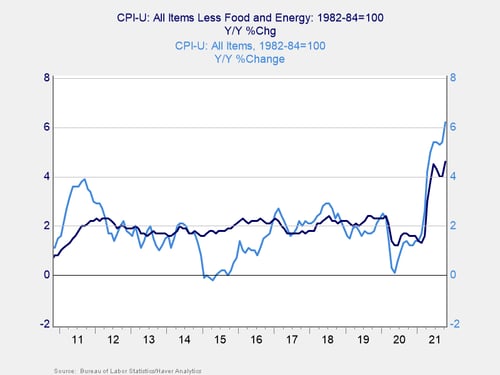
What does it mean to appropriately measure inflation? For most people, the only metric they see is the year-on-year Consumer Price Index (CPI) change. For them, that is inflation, and the 6.2 percent number in the most recent print generated significant fear. For more informed people, they might also be aware of core inflation, which excludes energy and food and is up a still scary, but much less so, 4.6 percent year-on-year.
What Matters to the Fed?
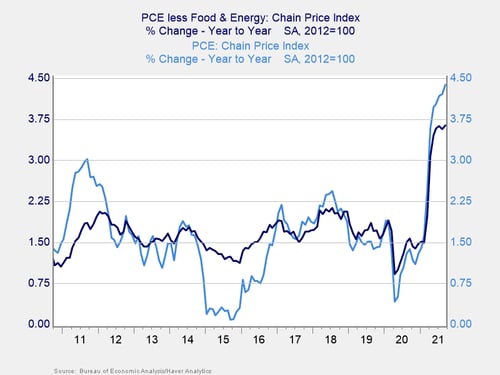
Funnily enough, though, these measures—what shows up in the headlines and public consciousness—are not what the Fed likes to look at. It tends to favor the personal consumption expenditure (PCE) inflation rate, which in the Fed’s view better captures inflation as related to monetary policy. Here, we see another drop from the headline CPI numbers, with the headline PCE at 4.38 percent and the core PCE, excluding energy and food, at 3.64 percent. These numbers are still scary, but again not nearly as much so.
What About COVID?
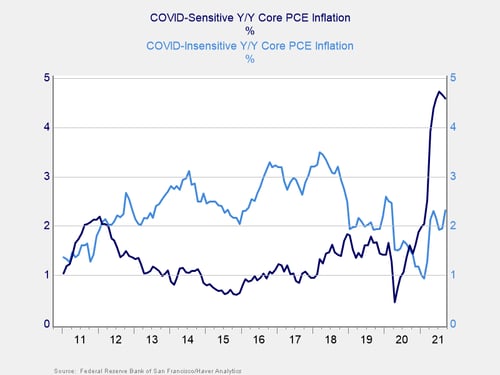
Even if we look at those indices, we still might not be done. The pandemic has had significant effects on inflation, pushing costs in some areas, such as used cars, well above historic levels. Perhaps we should adjust for those effects, because according to the Federal Reserve Bank of San Francisco, if we look at COVID-sensitive sectors, we get 4.6 percent annual inflation. But if we look at COVID-insensitive sectors, we get a core PCE inflation number half that, of 2.31 percent. If COVID fades, we can reasonably expect the COVID-sensitive inflation to fade as well—and as you can see below, COVID inflation has recently ticked down.
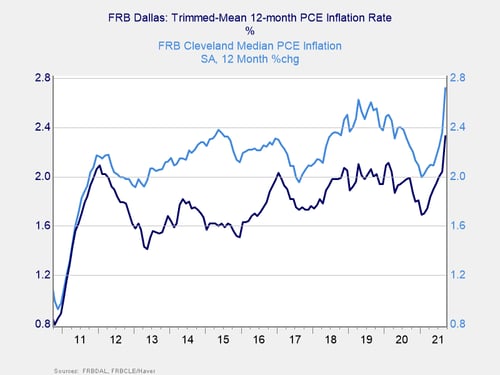
Yet there are always some sectors that are running hot and others that are running cold. How can we just exclude the effects of COVID without looking at the effects of other outliers? Fair enough, which is why two Federal Reserve banks, in Cleveland and Dallas, put out inflation measures that, in different ways, exclude outliers across the board. Here, we have inflation rates at 2.72 percent and 2.33 percent, respectively, for the past 12 months. This is with COVID effects, but stripping out the most affected sectors, on both the up and down sides. Once again, a much lower—and less scary—measure.
Is Inflation Close to Peaking?
When you look at the range of measurements, two things are clear. First, COVID is having, and has had, a significant effect, and that effect is likely to pass as the economic impact of the virus fades. That points to at least some of the current inflationary pressures subsiding over the next year or so. Second, if we take out some of the more extreme outliers in the current data, inflation is around 3 percent to 4 percent (or even lower), rather than the 6 percent the headlines suggest. The headline CPI overstates the actual sustainable inflation rate going forward—likely by a lot.
In fact, even the high headline number is somewhat artificial, due in large part to that 12-month lookback period. If you look at the past two years, instead of the past one, headline CPI inflation is around 7.48 percent, or about 3.74 percent per year. If we include the slump during the pandemic, as well as the bounce-back afterward, inflation is still high, but nowhere near where the headline number suggests. Once again, that one-year headline number overstates the case.
My own analysis is that inflation is probably close to peaking, as the collision of substantial demand driven by federal stimulus fades and supply chain problems moderate. With lower demand and greater supply, we should see price changes start to normalize. That will play out over months, not weeks. But in the first half of next year, we will likely see headline CPI move back down, likely to the 3 percent to 4 percent range, similar to what we have seen on average in the past two years. In the second half of the year, we will likely see some further moderation and will end the year at between 2 percent and 3 percent. This is above where we have been for the past several years, but it is well below where we are now.
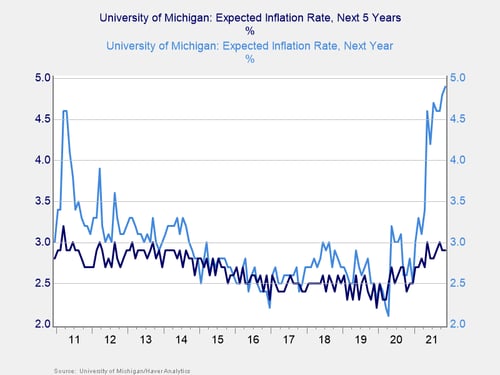
What’s more, if you look beyond the next year, both the public and the bond markets largely are in line with this expectation. The Michigan consumer survey inflation numbers show the public expects high inflation over the next year, but then for inflation to drop down to between 2 percent and 3 percent over the next five years. The bond market is keeping the interest rate on 10-year Treasuries around 1.6 percent. While inflation expectations are high over the next year, neither the public nor the markets expect it to remain high for much longer.
Measuring to Managing
And as we move from measuring to managing, that is good to know. If we measure inflation one way, we get one indicator and one course of action. If instead we measure it multiple ways and understand those measurements, we get a very different conclusion—and a very different proposed course of action. Which brings us back to my version of that business saying, measure appropriately so you can manage correctly. And here we are.


