

 Print
Print Some good news to report today: the coronavirus curve has been flattened. Now, you might wonder how I can say this when the cases continue to rise. In fact, no one has really come up with a definition of what “flattening the curve” means. So, from my perspective, it’s when the daily case growth rate declines enough that, despite the increased base of cases each day, the number of new cases declines. That scenario has now happened for several days in a row.
Daily growth rate
We can see in the chart below, based on data from worldometer.com, that the daily growth rate in new cases has come down sharply since the start of the month. That slower rate of growth, however, comes every day on a larger number of cases from the prior day. To see the number of new cases per day decline, the daily growth rate must drop below a critical value.
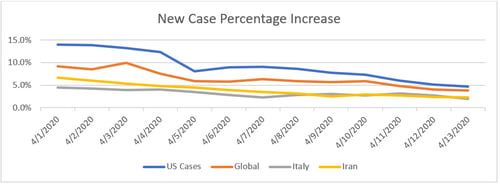
Source: Worldometer
New cases
Looking at the new cases chart below, we can see that drop has now happened. New cases per day peaked at just under 35,000 on April 8. Since then, they have declined to just under 27,000. While this number is still far too high, we will likely continue to see further declines both in case growth rate and in case growth.
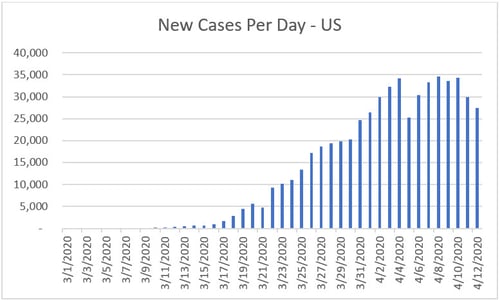
Source: COVID Tracking Project
A significant milestone
With the growth rate coming under control and the number of new cases per day stabilizing and starting to decline, you can see that those curves are flattening. We are not done, but we have hit a significant milestone. If current progress continues, we can see that new case growth can reasonably be brought down to low levels in the next couple of months.
This progress also moves the goalposts. Once new cases are under control, the analytical focus moves to the active cases, which are the total cases less recoveries and deaths. As the total case count flattens and the resolutions increase, the number of active cases will also flatten and then decrease. That has not happened yet. There is a lag between when cases are reported and when they are resolved. Even when the new case count stabilizes—and we may not be there for a month or more—it will still be a couple of weeks. We are not done with this pandemic yet.
Nonetheless, the fact that we can now see a path to that resolution reflects on how far we have come. As I have said multiple times over the past two weeks, we as a country know what to do, we are doing it, and it is working.
What’s next?
With the growth rate suppressed to a level where new case counts are declining, we have completed the first phase of controlling the virus. The next phase will be complete when new cases are less than resolved cases, which is when the active case count will start to decline. If current trends hold, that point might be in a month or so.
Current trends might not hold, of course. Our progress to date has depended on social distancing, and the success so far might result in less strict compliance to those policies. Even given that compliance, though, the virus is tricky. We saw case counts decline and then bounce back 10 days ago, and that could happen again. We need to watch for that.
The end of the beginning
Even given this risk, it is certainly worth noting the progress made so far. This really does look like the end of the beginning. The end of the middle will be when active cases start to decline. We are not there yet, but we can see it from here. It is not premature to start planning for the endgame: how the economy and markets emerge from the induced coma. We will talk about that later this week.


