

 Print
Print Almost two years ago exactly, I wrote the piece “Global Inflation Outlook: Are Lower Numbers on the Horizon?” Global inflation peaked at 14.3 percent that same month (April 2022). Initially, inflation sharply came off this top, hitting a low of 2.1 percent in May 2023. But more recently, we saw prints above 5 percent globally on a headline basis before returning to the 3 percent range by year-end.
Here, we’ll discuss the most recent inflation data, what’s driving global inflation, and where we might go from here.
The Inflation Story Across the Globe
Inflation is a global problem, but it affects each part of the world differently. In my previous post, we highlighted energy as a major driver of European inflation, as the price of natural gas spiked to more than US$65 per million British thermal units of energy. Today, the price is less than half that, just above US$28.
Several drivers are behind this decline, including gas supply lines that are shifting away from Russia to areas like Norway, the U.S., and North African countries such as Algeria. As a result, euro area headline inflation fell from a peak of 10.6 percent in October 2022 to 2.4 percent as of March 2024. Other factors driving inflation down in this region include elevated borrowing costs that have cooled the demand for goods and housing. Rising costs of shelter, energy, and goods led employers to pay their employees higher wages. These changes to labor costs tend to fall into the sticky inflation category.
In the U.S., inflation has remained higher than that of the eurozone, with the Consumer Price Index rising 3.5 percent year-over-year in March. Shelter and labor costs have been a major focus of the Fed. Shelter costs grew 5.7 percent over the prior year in the March report, while real average weekly earnings increased 0.3 percent month-over-month (3.66 percent annualized). That said, we continue to see odd ticket items (e.g., auto insurance up more than 22 percent year-over-year) that are also keeping inflation higher. Here, it’s important to keep in mind that the U.S. differs from Europe, Canada, and Australia, as the 30-year fixed-rate mortgage is by far the most common in the U.S. versus variable rates in parts of Scandinavia, Southern Europe, Australia, and Canada.
In emerging markets, inflation continues to have wide divergences. In its most recent report, China showed inflation of just 0.1 percent year-over-year, while other areas such as Turkey were as high as 68.5 percent. India, Indonesia, Mexico, Brazil, South Africa, and South Korea were much closer to the emerging markets average of roughly 3.5 percent, ranging from 3.1 percent to 5.3 percent. In the case of the large players, China continues to see soft consumer demand in the wake of its real estate issues. India, on the other hand, continues to see strong growth in its economy and to take on infrastructure products as it benefits from strong demographics, a well-educated workforce, and continued investor-friendly reforms.
Potential Divergence in Central Bank Policies?
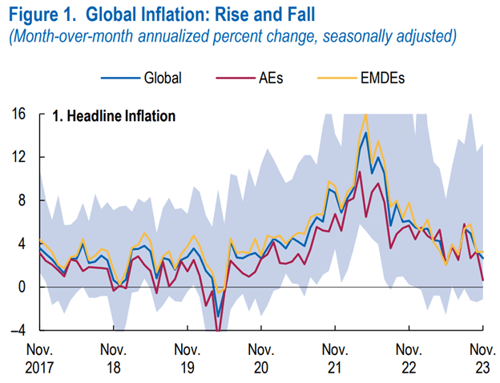
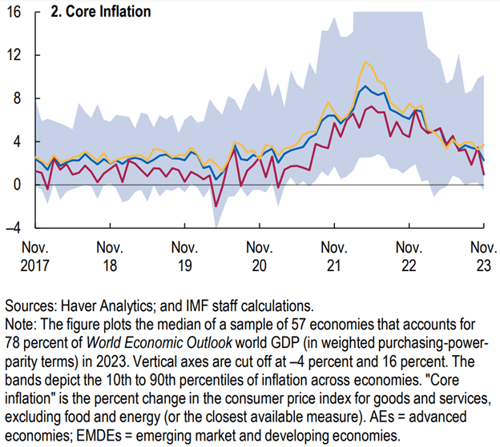
The chart below from the IMF shows the path of global headline and core inflation (excluding food and energy) for advanced economies, emerging market developing economies, and the global aggregate. Recently, the advanced economies have continued to decelerate outside the U.S. Despite this, the deceleration has not been equal across all advanced economies. Rapidly falling inflation and slower economic growth overseas have the potential to lead to rate cuts by the European Central Bank, the Bank of England, and the Bank of Canada before the U.S. Federal Open Market Committee (FOMC). As relative interest rates play into currencies, there could potentially be a near-term window of continued U.S. dollar strength, which will impact areas such as commodity markets that are predominantly priced in U.S. dollars and other exports.
Global Conflicts a Cloud of Worry
Beyond the data, several events happening around the world could have meaningful effects on inflation globally. Let’s discuss just a few we are keeping an eye on.
As we all know from 2020 and the years that followed, shocks to the supply chain can take time to resolve. I still vividly remember going to the grocery store only to find they had run out of common items like chicken. In today’s world, we continue to deal with supply chain issues via the blockade of the Red Sea shipping lanes, a Panama Canal that has been slowed due to water levels, and more recently the potential effect that the unrest in the Middle East could have on additional shipping lanes, such as the Strait of Hormuz with rising conflict between Israel and Iran.
Despite the risks, global inflation has come down faster than expected, although fiscal policy can lead to divergencies between economies.
The U.S.: Higher for Longer?
The good news is inflation is well off its peak. The bad news? The U.S. has specific challenges that may keep our inflation higher for longer relative to the rest of the world. These include the structure of U.S. shelter financing via fixed-rate mortgages and fiscal expenses via international aid, defense, and broader government spending that will likely continue to stimulate the U.S. economy. Meanwhile, areas such as Europe, Australia, and Canada may have a better case that they are overly restrictive and can begin cutting rates.
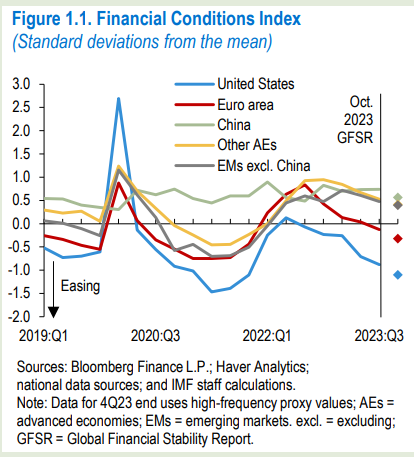
The chart below from the IMF highlights the financial conditions in the U.S., euro area, China, other advanced economies, and emerging markets (excluding China). The U.S. is furthest into the easing financial conditions territory. While we have seen yields rise dramatically after Q1 Consumer Price Index numbers, on a relative basis, the U.S. has historically easy conditions as the Fed balance sheet remains substantially larger than it was before 2020, with roughly $7.5 trillion less eliminations versus roughly $4.5 trillion before 2020.
The Path Ahead
It’s likely that the FOMC in the U.S. still has some work to do to get inflation to its 2 percent target. Its preferred gauge, the core personal consumption expenditures figure, will be released on April 26. It is expected to come in at roughly 2.7 percent year-over-year. While still above 2 percent, this result could lend credence to the idea that the FOMC may ease rates to gradually approach 2 percent over an extended time frame.
Due to this potential path forward, we would look to continue to seek balance and diversification across portfolios, with both growth and value playing a role as the Fed works to bring the economy in for landing at more normalized levels of inflation near 2 percent.


