

 Print
Print When I hear the words "Groundhog Day," I always think of the movie, not the holiday. Here in Massachusetts, we’re more or less guaranteed six more months of winter, so we don’t pay too much attention to the groundhog. The movie, on the other hand, really does speak to me.
In case you haven’t seen it, Groundhog Day is the story of a very selfish man, played by Bill Murray, who is forced to relive a day over and over until he gets it right. I'm not spoiling anything if I tell you that, before he gets better, he gets worse—much worse. You really should see it. Go ahead, I’ll wait.
There, wasn’t that a great movie? Now that we’re all on the same page, on to the actual post.
This time: probably not different
When it comes to economics and financial markets, pretty much every day is Groundhog Day in some respect or another. The underlying dynamic that drives both is people, and people don’t really change much. Like Bill Murray in the movie, we tend to do (and think) the same things over and over, with the same results.
Right now, for example, a new administration is coming in, taking action, rattling existing relationships, and redefining where the U.S. stands. Although worries abound, we saw versions of this at the beginning of the Obama administration, of the last Bush administration, of the Clinton administration, and so on. Arguably, the Trump administration is in the typical start-up phase right now, and we should expect more teething troubles. The news from Washington, DC, may continue to be worrisome for a while, but this stage will most likely pass.
Less immediately, but of more direct concern to investors, we're also in a Groundhog Day state with respect to stock market valuations. Every decade or so (usually in the latter half), there’s a boom that drives stock prices up, followed by a decline. You can see this in the chart below, which goes back to 1927.
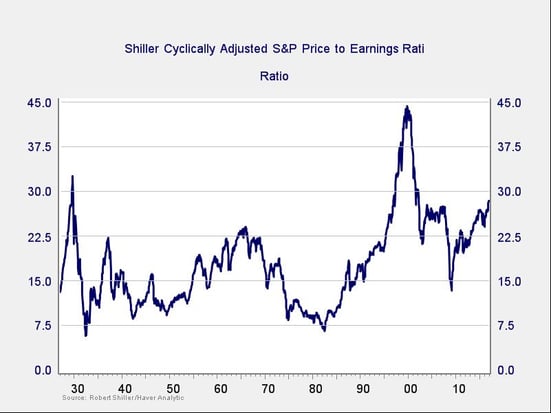
1929, 1937, 1946, 1956, 1965, 1973, 1987, 1999, 2007 . . . The average time between peaks is just under nine years, and the range is between eight and twelve years. Each time valuations climbed higher, the narrative was “this time is different.” In 2007, we told ourselves that the national housing market had never declined. In 1999, we had a new economy. And so forth.
Each time, there seemed to be a good reason for values to keep increasing indefinitely, and each time the reason turned out to be spurious.
Markets won't change their ways anytime soon
Which brings us back to today. We’re 10 years from the last peak, at the end of the historical cycle. Valuations are higher now than at any time except for 1929 and 1999. But this is fine, we rationalize, because interest rates are lower than they’ve ever been and will stay there. Think about it: at cycle-end, values are very high, but there’s a factor that justifies them and (we're sure) will continue to do so.
Groundhog Day? Maybe so.
This isn’t to say the markets are heading down anytime soon. In fact, I expect a reasonably healthy year, although risks are rising. (That's why we'll continue to monitor market risk factors each month, as well as bear market risk factors.)
But the markets are what they are, and every time we think things are different, they aren’t. In fact, markets won’t change until people do (i.e., not anytime soon). And if markets won’t change, investors will have to change their own behavior—or see the same results as ever.


