

 Print
Print There has been a great deal of coverage about the expected rate cut by the FOMC at its regular meeting this week. Markets are counting on a cut of 25 bps (one-quarter percentage point), which has pretty much been confirmed by the Fed. There is even some betting that the cut will be twice as much. In any case, this move has been widely cheered as a necessary precaution—an “insurance cut” in the jargon—to prevent an economic slowdown from turning into something worse. If we step back and look at the big picture, though, there is less to cheer about.
Sign of trouble ahead?
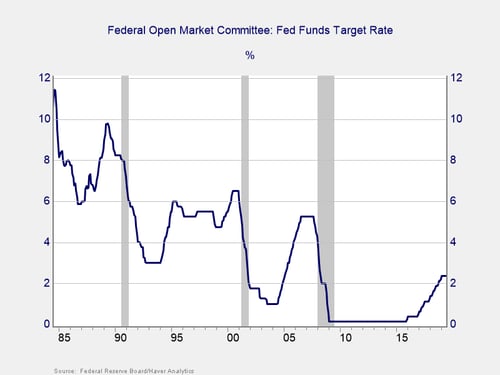
Looking at the past 35 years, there have been few cases where the Fed stopped with one cut. More, a series of cuts has often been a leading indicator of a pending recession, especially for 1989, 2000, and 2008. In these cases, off a peak in rates, the start of cuts meant that the Fed saw a recession coming. Further, a recession usually showed up within a year or so, with the Fed cutting rates or keeping them low throughout the recession and the start of the recovery. But this scenario wasn’t always true. In two instances, the Fed got it right: in the mid-1980s and early 1990s, rates were cut and a recession was averted.
So, there is precedent for insurance cuts. But even there, the Fed doesn’t stop at one. In both the mid-1980s and early 1990s, there was substantial economic turbulence, although we avoided a formal recession. Overall, the lesson remains that if the Fed is worried enough to start cutting rates, there is a better than 50 percent chance of a recession. Even if that is avoided, there is still very likely trouble ahead. So, I am not going to cheer too much about the rate cut—and will cheer even less if we get a cut of 50 bps.
Less room to cut
Another concern I have is where we are starting to cut. There is a sense that rates never did normalize after the 2008 crisis. Looking at the chart above, you can see the size of the gap. The Fed funds target rate was 5 percent or above in the mid-1990s, and it recovered to that level in the mid-2000s. Since then, we have had even larger cuts. But during the (much longer) recovery this decade, rates never got close to that level, peaking at the current rate of 2.25 percent to 2.50 percent. Rates are nowhere near where they were prior to the last recessions. Because of that, the Fed simply has less room to cut.
Given the starting point, a 25 bp cut will exhaust a big part of the ammunition. A 50 bp cut would eat up almost one-quarter of the potential cuts. The case to do that is to prevent the slowdown from getting worse, so more cuts are not needed. But as we have seen, odds are that more cuts will be needed. Burning through a big chunk of the available cuts this early in a slowdown is a big bet that (1) the slowdown is serious and (2) this move will solve the problem. Both assumptions are far from certain.
Look for the signs
At this point, some kind of cut is baked in, and not cutting would certainly rock markets. We can count on the 25 bp cut. But a larger cut or hints in the commentary that more cuts are coming is likely to be a bad sign rather than a good one. Such hints may boost the market a bit but could spell trouble sooner rather than later.


