This post originally appeared last summer. Now, as we close out 2015, I want to revisit whether the theory actually played out.
Predictions of doom and gloom in the financial markets or economy tend to try my patience—unless they are supported by fact—so I’m understandably skeptical of the Shemitah, a prophecy that suggests the potential for a financial crisis every seven years. Imagine my surprise, though, when I looked more deeply into this story and discovered that there is something to the theory of a seven-year cycle in U.S. financial markets.
Identifying the pattern
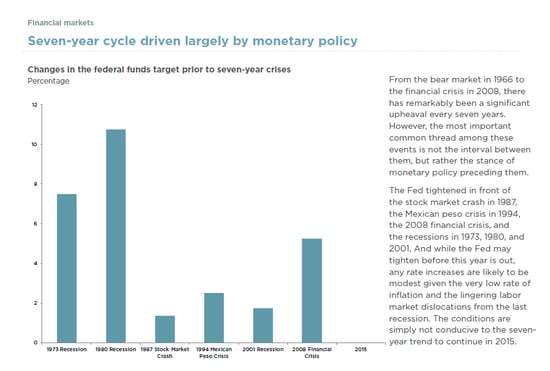
As often happens, if you wait long enough, someone else does the work for you. In this case, it’s a report from Nationwide Insurance, which shows the same seven-year market cycle overlaid on a reasonable explanatory variable: an increase in interest rates by the Federal Reserve.

Source: Federal Reserve Board of Governors
Rising rates make sense as a potential trigger for financial turbulence, and if you look at this chart closely, it may well indicate future trouble. Historically, the fed funds rate needs to increase by more than 1 percent before we see a serious reaction, so even with the recent interest rate increase, we have a ways to go.
Interest rate expectations
On December 16, the Fed finally agreed that the economy has recovered enough that it was time to increase interest rates—by 25 basis points, or 0.25 percent. It’s not a large increase, but it is a move in the right direction.
Looking at the bigger picture, when the Fed increases short-term rates, longer-term rates have typically followed. This time may be different, though, at least for a while, as both the European and Japanese central banks continue to buy bonds to keep rates low. The effects of this are flowing into the U.S. and keeping rates here low as well. I believe this should continue, meaning that the seven-year cycle—which was due to hit us this year—could end up stretching to eight or even nine years.
The trouble with magical thinking
As you can see, examining the underlying causes of a pattern may be a better way to evaluate the future than simply looking at history and extrapolating out from there. I find that many of the more extreme views—positive and negative alike—have this flaw. Magical thinking suggests that recent experience is the best indicator of the future—and therefore everyone continues to buy or sell. This is how both bubbles and crashes come about.
I’m not saying we don’t have challenges and concerns. We saw several pullbacks in 2015—we were close to correction territory in September—and risks, largely external, remain. The underlying facts are supportive, however, and the time to look for serious trouble is when those facts start to decay.
Jobs data continues to be strong, consumer demand is moving in the right direction, the market is finishing the year on a positive note, and the Fed has indicated its faith in the economy by raising rates.
Will we face trouble in the future? Certainly. When we do, though, it won’t be because of some prophetic cycle or apocalypse. Our troubles will be of our own making, which means they’ll also be solvable by us.


 Print
Print


