 As you can see from the clip I posted earlier today, I spent yesterday in New York. One of the things I try to get from these days in the field is to identify overarching concerns and themes, and this time that was easy. The main concern of almost everyone was growth—growth in the economy, growth in earnings, and growth in general.
Time after time, I got the same question: where is the growth going to come from?
In order to answer that, we first need to look at the underlying assumption, which is that something is broken. So let’s try to identify some reasons growth might be low and what that might mean.
The demographic analysis
We hear a lot about how the baby boomers are retiring and various arguments about what this means for growth. Let’s see what the actual data tells us.
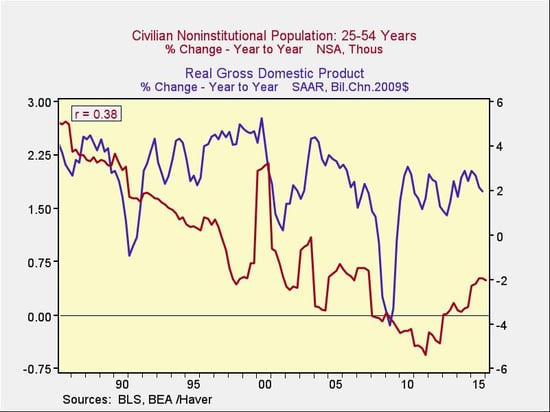
The chart below covers the past 30 years, comparing the change in the 25- to 54-year-old population cohort to economic growth, after inflation has been stripped out. I chose this population segment because it's the most economically active and because it captures both the effects of the baby boomers and other generations on growth over time. Basically, we’re trying to see whether a change in the size of this segment of the population affects how quickly the economy grows.

The answer appears to be yes, since more than a third of the change in growth (r = 0.38) was correlated with the change in population. Given everything else involved, this is meaningful.
I also sliced the data in different ways to test that conclusion:
- The most recent 20 years showed an even stronger connection, which supported the conclusion.
- The most recent 10, however, did not, which may well be due to the fact that baby boomers have been aging out of this cohort. It's also probably due to the crisis and recovery, which dominated this period, overwhelming demographic effects during the time frame.
- Longer periods also show less of a connection, although it still remains meaningful. This is probably due to the fact that the baby boomers dominated this age cohort over the most recent 30 years, but not before.
Overall, then, the idea that changes in population—more specifically, in the most economically active age groups—can and do affect economic growth appears to be supported by the data, as well as by common sense.
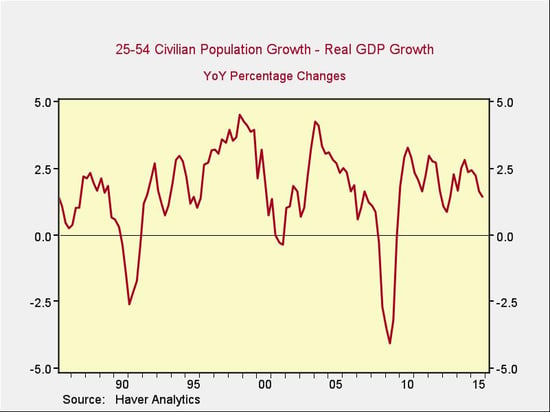
As you can see in the initial chart, the decline in this population cohort can explain a good part of the slow growth we have experienced in recent years. Another way to look at this is to subtract the change in population from economic growth, to estimate the base growth rate, before population changes, as shown in the following chart.

This is an interesting chart, becase you see that average growth is around 2.3 percent to 2.4 percent over the past 30 years after you subtract the effects of the baby boomers entering and exiting the economy. Looking at it this way, current growth actually seems reasonably normal, right in the middle of the historical range.
Much of the shortfall is therefore coming from slower population growth, and not some structural problem. The good thing is that there is no problem; the bad thing is that slower growth doesn’t look solvable absent an increase in population growth.
Population growth likely won’t provide a huge boost
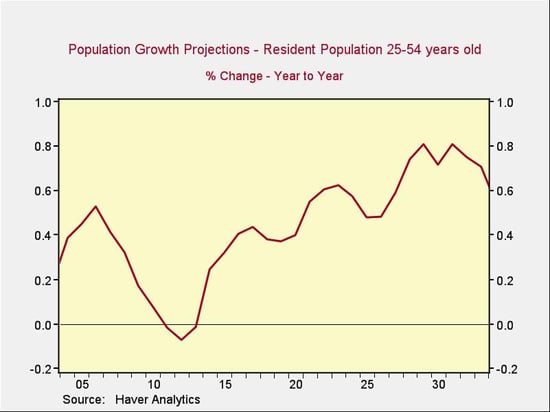
Which brings us back to the initial concern: what does this mean for future growth? The great thing about demographic analysis is that we actually have the answers. All of the people who will move into the 25–54 age group for the next 25 years have already been born.
The biggest piece of any demographic change over the next 10 years will be the millennial generation. As you can see from the first chart above, millennials have already started to move into this population cohort in the past three years, with growth resuming after several years of decline. But will that growth continue?

With current population growth in this key cohort around 0.3 percent, the increase to around 0.8 percent over the next 10 years or so will have a material positive effect, but it will only increase the base growth rate from the current 2 percent to 2.5 percent or so up to around 3 percent at best.
This will certainly help, and it will be a tailwind overall, but it won’t get us back to the growth rates everyone is looking for. Less-slow growth is better, but it’s not the same as fast growth.
That’s the not-so-good news. There is, however, better news about why recent growth has been slow, which does offer some possibility for improvement. We’ll talk about that tomorrow.


 Print
Print


