

 Print
PrintAfter the good news a month ago, several of the major economic indicators I track are moving downward once again. The service sector was the biggest negative surprise, but job growth also came in below expectations. While other news was positive, particularly in the realm of consumer confidence, and there are no signs of immediate trouble, weak data for the business sector suggests the recent rebound may have been only temporary.
One month’s data won’t reverse the recent positive trends, but the magnitude of the latest poor data points raises real concerns. Although the signal for the economy remains at a green light, it’s once again taking on a yellowish tinge.
The Service Sector
Signal: Green light
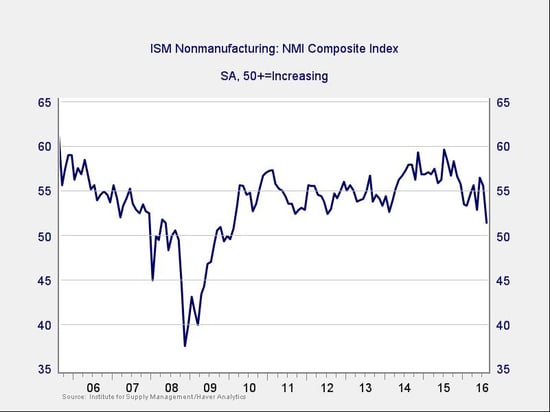
After rallying back up in the past couple of months, following a sustained downward trend, service sector sentiment dropped sharply this month to a six-year low. Although this index remains in expansionary territory, the size of the drop raises a question: was the bounce in recent months real?
As always, though we can’t get too excited over one month of data, the drop suggests a more cautious stance going forward, especially since other metrics such as the manufacturing index have also turned over. Business and employment expansion look increasingly unlikely to accelerate, and we may have to revise our expectations down.
Continued strength in the service sector is consistent with business confidence; as a representative sample of the largest sector of business, this is an important leading indicator.
Private Employment: Annual Change
Signal: Green light
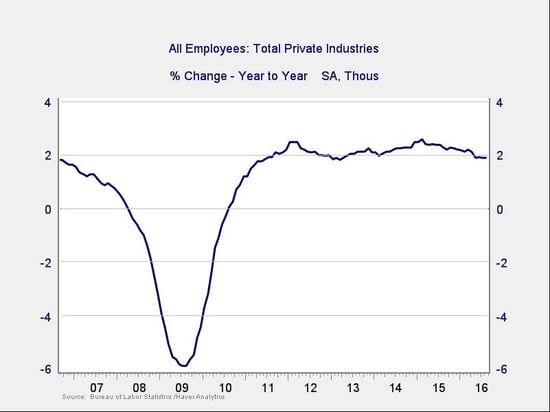
August job creation was disappointing, coming in below expectations. Although a pullback from the very strong levels of the previous months was expected, the weakness of the report extended beyond the number of jobs. Decreases in both the average workweek and wage growth testified that labor demand was much weaker than expected. At the same time, August has disappointed for the past five years in a row, only to be revised up later, so there may be a seasonal adjustment issue here rather than a real slowdown.
The annual trend, while down, remains stable with this month’s data and is at levels consistent with steady growth like that of the mid-2000s. The next couple of months will be critical to see if it remains around those levels.
Because this is an annual figure, the changes are slower and smaller than those we see in more frequently reported data. Overall, given the volatility of employment growth, this indicator remains a green light.
Private Employment: Monthly Change
Signal: Green light, but needs to be watched
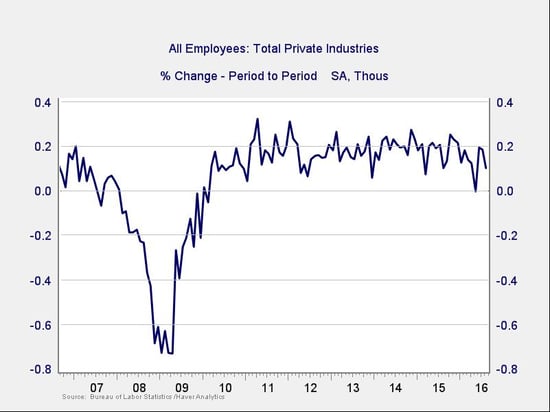
These are the same numbers as in the previous chart, but on a month-to-month basis, which can provide a better short-term signal. August’s job creation was disappointing on many levels, but it remains within the range of the past couple of years. Given the possible seasonal adjustment problem, this is not a major concern yet.
We’ll keep this metric at a green light for the moment, but I’ll be watching it to confirm that the positive trend of job growth continues.
Yield Curve (10-Year Minus 3-Month Treasury Rates)
Signal: Green light
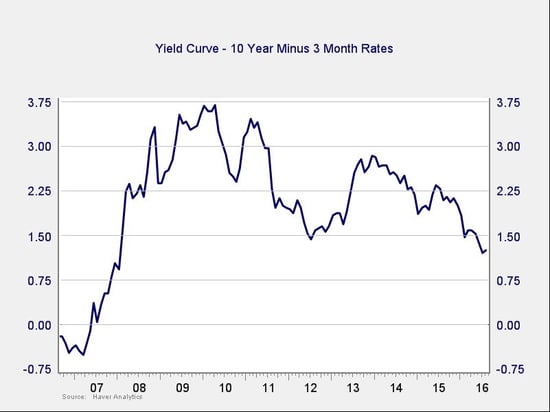
With Janet Yellen describing the U.S. economy as in reasonable condition—and other officials hinting that rates would likely go up sooner rather than later—rates for the 10-year Treasury rose over the past month, only to reverse as weak data seemed to make such an increase less likely. The net effect was that the spread between short- and long-term rates rose slightly, although it remains at a low level.
Though still outside the risk zone, the trend remains generally negative, and a further decrease seems quite possible. The negative risk here is much smaller than with the other indicators; unlike in past cases, the drop in longer rates appears to be driven by demand from foreign investors, which may make this signal less applicable at this time.
Consumer Confidence: Annual Change
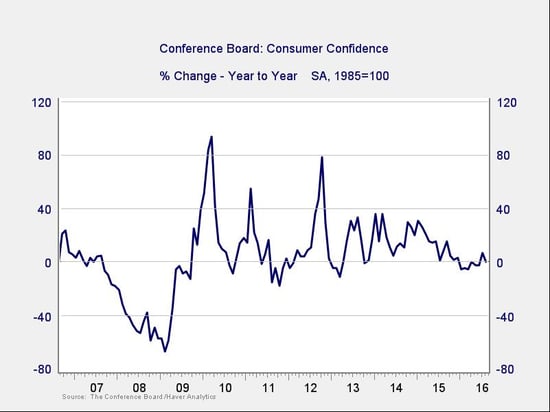
Signal: Yellow light
Consumer confidence increased substantially this month, beating expectations, but the year-on-year growth rate ticked down. With the year-on-year change around zero, it remains well away from the trouble zone and appears to have stabilized. Although business data is weak, consumers continue to grow both earnings and spending, and rising confidence should keep this indicator at healthy levels.
That said, the current improvement was largely based on consumers feeling good about the present; the survey shows they feel much less positive about the future. Therefore, though the recent improvement is real, given the decay in other data points and lower future confidence numbers, we’ll leave this at a yellow light until we see a couple more months of positive news.
Conclusion: Economy healthy, but negative trends may be resuming
Business confidence has clearly decayed more than was expected, and the possibility that the negative trend has resumed is real. Consumers continue to do well, but the potential slowdown in employment growth and concerns about the future suggest that might be vulnerable as well.
Again, one month of data is not sufficient to make that call, but a resumption of negative trends is quite possible. The risk level has risen, and we certainly need to watch how the economy evolves. Given the generally healthy levels of the data before this month, however, and the continuing strength of consumer confidence, I am leaving the overall economic indicator at a green light.


