Print
PrintAfter a difficult quarter, April’s data showed signs of meaningful improvement. Job growth bounced back, easing a major concern. Plus, consumer confidence improved, which should help growth going forward. On the other hand, business confidence dipped further, and the yield curve remains close to a risk level.
Overall, there was real improvement. But the risk level remains elevated, and signs of slowing growth persist.
The Service Sector
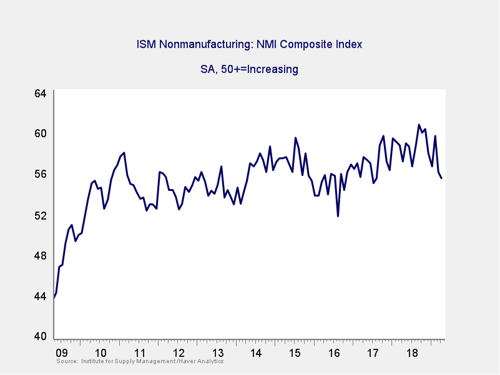
Signal: Yellow light
As a representative sample of the largest sector of business, this is an important leading indicator. It dropped back further last month, taking it to the lowest level in almost two years. Although it remains within expansion territory and within the range of the past two years, it is nearing the bottom of that range. In addition, the manufacturing index has recently weakened, which adds color to this reading. Although conditions remain expansionary, the risk level seems to be rising. As such, we are taking this indicator to a yellow light.
Private Employment: Annual Change
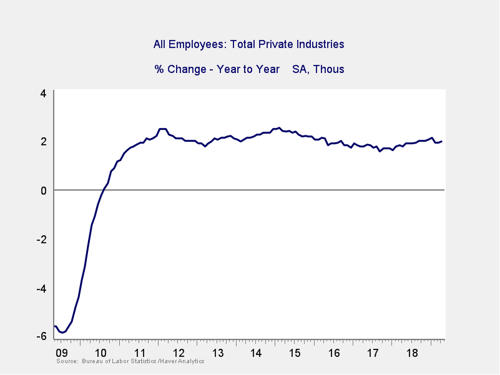
Signal: Green light
With a significant upside surprise to job growth in April, private employment growth year-on-year steadied, after a pullback on February's weak job creation number. It remains at healthy levels (at or above those of the mid-2000s), suggesting that the decline in the growth rate has stabilized for the moment and may have reversed. Because this is an annual figure, the changes are slower and smaller than those we see in more frequently reported data, but the trend continues to be positive.
Private Employment: Monthly Change
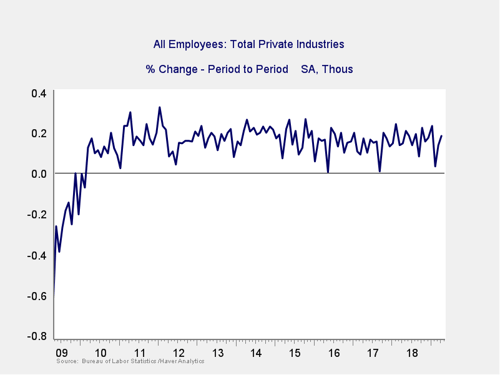
Signal: Green light
These are the same numbers as in the previous chart but on a month-to-month basis, which can provide a better short-term signal.
After a strong March, April’s job creation was both very strong and well above expectations. This result has more than offset the weak February number. Further, this rebound indicates that employment growth continues at a steady pace and alleviates some of the concern for this indicator. Total employment growth remains healthy, within the range for this recovery.
Yield Curve (10-Year Minus 3-Month Treasury Rates)
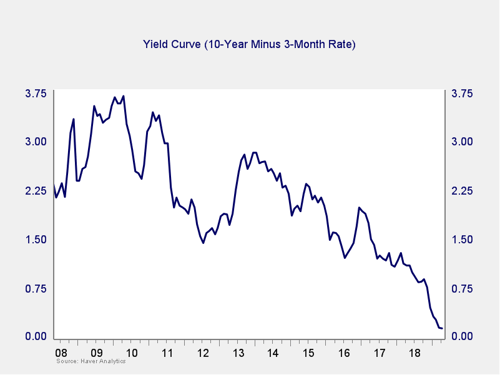
Signal: Yellow light
After a brief inversion lasting only three days, rates normalized last month, leaving the spread positive again. As you can see, the brief inversion doesn’t even show on this monthly chart. As such, it does not appear to be a recession signal, but it is a risk indicator. Further, the trend over the past couple of months has changed from positive to negative, and it has now extended long enough to suggest this is likely a fundamental negative shift. Therefore, we are keeping this indicator at a yellow light.
Consumer Confidence: Annual Change
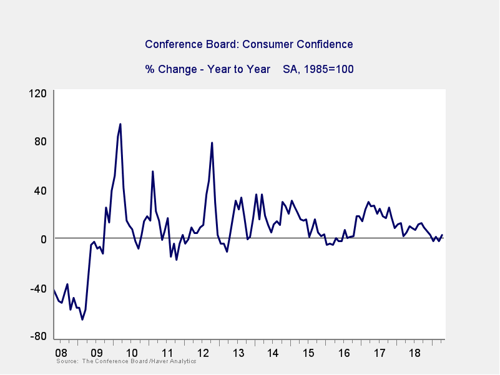
Signal: Yellow light
Confidence bounced back further in April, taking it close to recent highs and keeping the year-on-year change above the zero level, leaving it well above problematic levels. With the absolute level of confidence recovered and with the annual rate flat, this indicator has improved. But the recent trend of a flat year-on-year change, rather than an improvement, suggests risks remain. As such, we are leaving it at a yellow light.
Conclusion: Risk remains elevated
Despite a bounce in job growth and higher consumer confidence, we did see a deterioration in business confidence and continued indicators of risk from the yield curve. Still, all the risk factors remain well out of the red zone.
Although a continued slowdown remains the most likely case based on the data, a slowdown is not a recession—we likely still have several quarters to go there. Nonetheless, the bulk of the data indicates the risks of a continued slowdown remain material. Because of that, I am leaving the overall risk level at a yellow light for the economy as a whole for May.