Print
PrintApril’s data continued to be solid overall. Job growth recovered and March’s weak report was revised upward significantly, easing one concern. Consumer confidence also bounced back a bit. More worrying is that business confidence moved further off the high, although this would be a change in trend rather than an immediate concern. Fed policy continues to be stimulative, which is helpful, despite the recent rate increase. Overall, the economic data indicates that growth continues, although it may have peaked.
The Service Sector
Signal: Green light
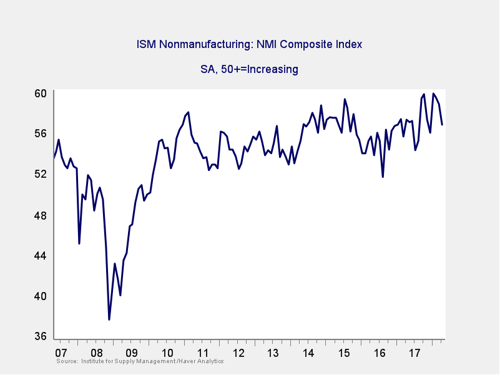
Business confidence remained at high levels, although the Institute for Supply Management (ISM) Nonmanufacturing index dropped for the second month in a row. The drop—to 57.3 for April from 59.3 for March—was somewhat below expectations but still leaves the index at a level that supports strong growth. This is a diffusion index, where values above 50 indicate expansion. Its continued strength suggests that growth is likely to continue in 2018, but the recent pullback indicates that growth might have peaked. Going forward, these levels of confidence should keep driving economic growth, leaving this indicator at a green light.
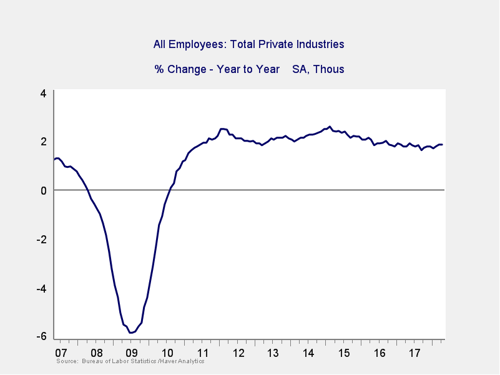
Private Employment: Annual Change
![]()
Signal: Green light
April job growth came in at 164,000, while March was revised up from 103,000 to 135,000. This result suggests March’s weak report was an outlier and that job growth continues. On an annual basis, job growth remains strong. Further, the long-term trend continues to be positive, with 2018 growth above that of 2017. The annual figure again showed improvement, so this indicator remains a green light.
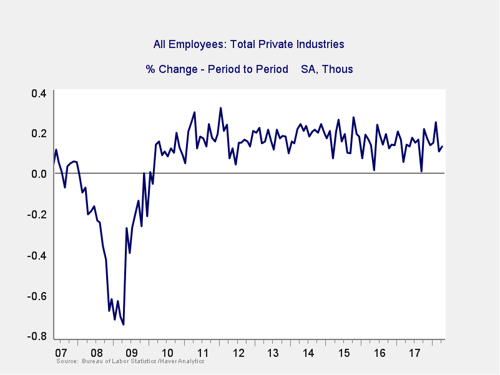
Private Employment: Monthly Change
Signal: Green light
These are the same numbers as in the previous chart but on a month-to-month basis, which can provide a better short-term signal.
As noted above, April’s results and the upward revisions to job creation in March suggest that the initial weak March figure was an outlier, rather than something worse. Overall, job growth continues to be high enough to keep up with population growth, while the rise in the employment-to-population ratio suggests that people are moving back into the labor force. As with the other signals, and given the continued positive long-term trends, this indicator remains a green light.
Yield Curve (10-Year Minus 3-Month Treasury Rates)
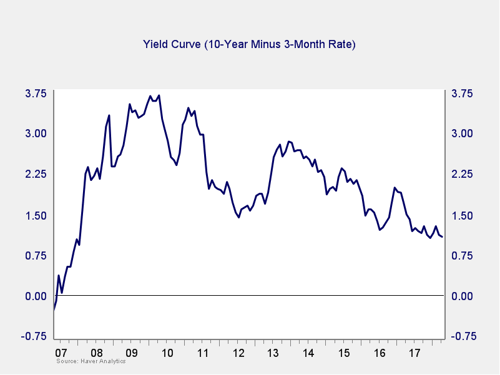
Signal: Green light
The spread between the 10-year and 3-month rates dropped a bit last month, as the Fed raised rates by 25 basis points (as expected). But the decrease was limited, as longer-term rates ticked up in the face of rising concerns about inflation. While this takes us slightly closer to the trouble zone, we are still outside the immediate risk levels. As such, we are leaving this indicator at a green light. Future rate hikes by the Fed might narrow the spread even more, which will be a key area of concern as we move further into 2018 and will need to be watched.
Consumer Confidence: Annual Change
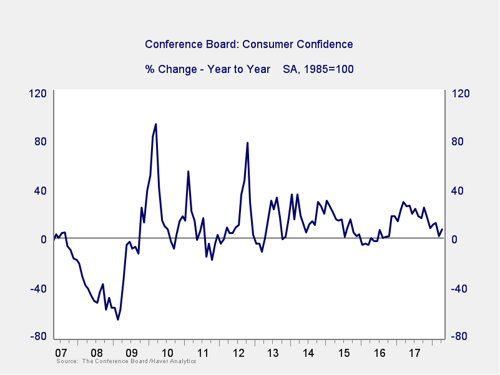
Signal: Green light
Consumer confidence increased slightly in April, returning it close to February’s peak—which was the highest level since 2000. The small increase also took the annual change back above zero, alleviating immediate concerns of a further decline. While this indicator remains well outside the trouble zone, the sustained decline throughout 2017 suggests confidence growth may indeed have rolled over, despite this month’s bounce. So, we will need to keep an eye on it. That being said, consumer confidence remains at a very high level. Plus, the annual change is still well outside the trouble zone, so we are leaving this indicator at a green light.
Conclusion: Economy growing, positive trends may be peaking
All four indicators remained positive on an absolute basis, but pullbacks in several indicators continue to suggest that the recovery may have peaked as we move into a slower growth phase. Conditions remain favorable overall, however, and the economy gets a green light for May.