Print
PrintAfter signs of weakness in January, the question was whether we would see a rebound in February. In some areas—consumer and business confidence—we did, largely driven by the end of the government shutdown. This confidence rebound has reduced risk going forward, although we need to pay attention to whether it holds.
The bad news was a surprisingly weak jobs report, with only 20,000 new jobs. Although this is a terrible headline, the supporting data was better. As such, this report is likely a one-off, which we have seen before, rather than something worse. Nonetheless, this is something new that will require attention.
So, although there are some signs of slowing in the short-term data, longer-term trends still remain positive and all the risk indicators are still well outside the risk zones. Overall, the basic conditions remain favorable on a longer-term basis, despite rising risks.
The Service Sector
Signal: Green light
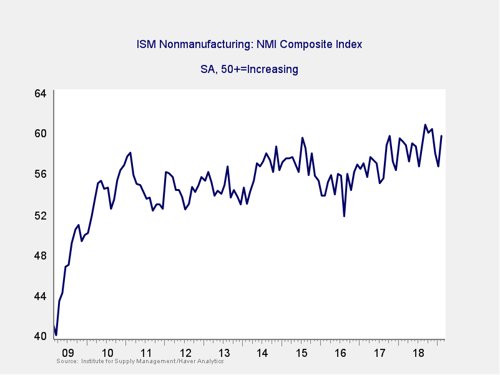
Last month, business confidence bounced back close to last September’s 21-year high, after a significant drop over the past couple of months. Despite the drop and bounce, however, confidence remains at the upper end of the range of most of 2017 and 2018 and at a healthy level overall. This is a diffusion index, where values above 50 indicate expansion. So, the current level suggests that growth is likely to continue for the next several quarters. The indicator also remains consistent with the long-term trend line (as you can see in the chart above), suggesting that business confidence remains on an uptrend despite the recent decline. Overall, while risks are rising, with the current healthy level, this indicator stays at a green light.
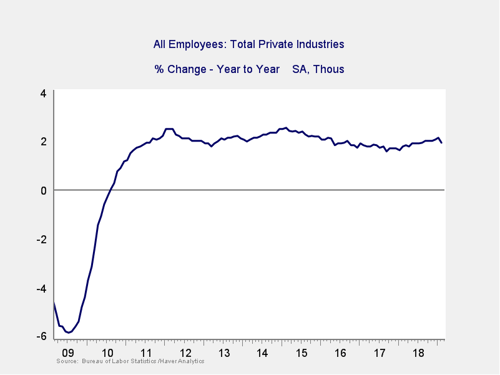
Private Employment: Annual Change
Signal: Green light
February job growth came in at 20,000, which was shockingly below expectations. This result came after two strong months, however, and the supporting data from other surveys was much more positive. Together, this suggests that this report may be an outlier, rather than the start of a more sustained slowdown. Also supporting that idea is that this has happened twice before in this recovery. On an annual basis, per the chart above, job growth remains strong. The continuation of growth in the year-on-year trend suggests that labor demand remains strong and is likely to stay at a healthy level for the foreseeable future. As such, this indicator remains a green light.
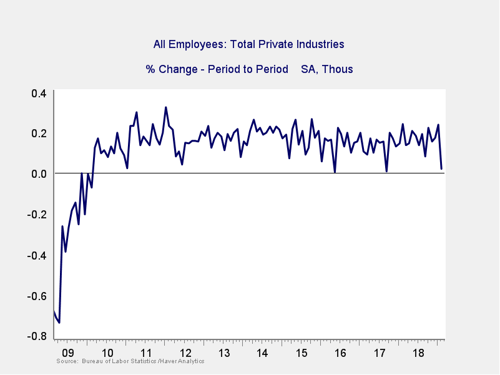
Private Employment: Monthly Change
Signal: Green light
These are the same numbers as in the previous chart but on a month-to-month basis, which can provide a better short-term signal.
As noted above, February came in well below expectations. But as the chart above shows, this has happened before and is not necessarily a sign of future trouble. We will need to watch this indicator carefully in future months. Right now, however, it is premature to worry too much, given the likelihood that this is a one-off possibly driven by the decline in business confidence from the government shutdown. Given the continued healthy long-term trends, this indicator remains a green light for the present.
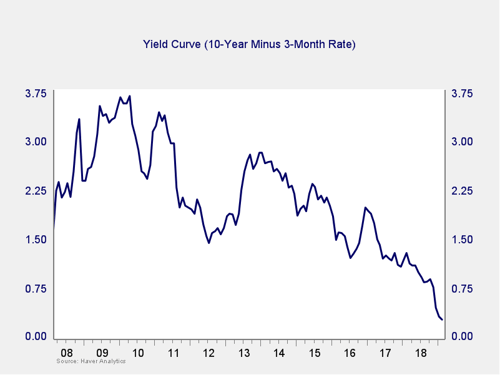
Yield Curve (10-Year Minus 3-Month Treasury Rates)
Signal: Green light
The spread between the 10-year and 3-month rates ticked down last month, as 10-year rates dropped back further after a spike. This decline in the spread takes us closer to the trouble zone, but it is still well away from it. In addition, lower long-term rates should help growth. Overall, we are leaving this indicator at a green light.
Consumer Confidence: Annual Change
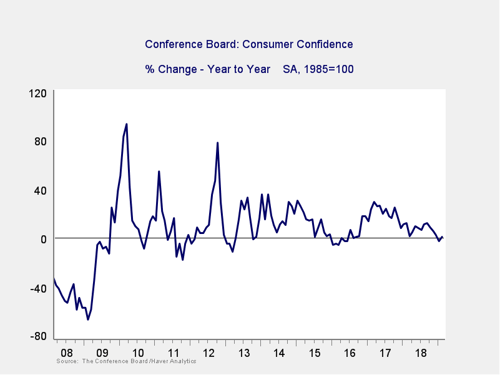
Signal: Yellow light
Consumer confidence bounced back to high levels in February after two months of declines, which also brought the annual change back above the zero line. The decline over the past couple of months is a concern. But the bounce back, combined with the high absolute level, keeps us well above the trouble zone.
Even given last month’s rebound, however, risks have clearly risen, especially as the recent bounce may not be sustained. We are keeping this indicator at a yellow light to reflect that.
Conclusion: Economy growing, some slowing but trends still positive
All four indicators remained positive on an absolute basis, and the data continues to be healthy. Although signs of weakness in job growth bear watching, recent improvements in consumer and business confidence after a period of relative weakness suggest that present conditions remain favorable overall.
The economy gets a green light for March.