Print
PrintAfter a difficult first quarter, April’s data was better. But, in aggregate, May has not continued that improvement. Job growth has slowed further, taking it closer to a risk level. Plus, the interest rate outlook continues to deteriorate, with the yield curve now inverted for a period of weeks. Not all the news was bad: both consumer and business confidence improved, which should help growth going forward. Overall, though, risk levels have increased somewhat.
The Service Sector
Signal: Yellow light
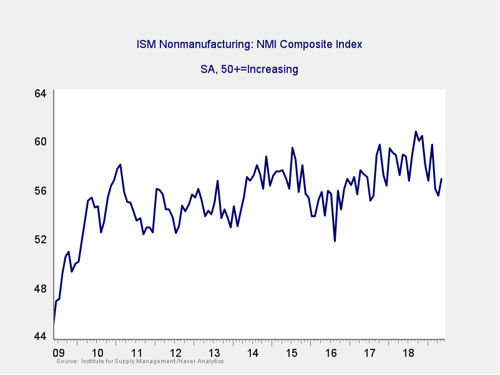
As a representative sample of the largest sector of business, this is an important leading indicator. It rebounded a bit last month but remains close to the lowest level in almost two years. In addition, the manufacturing index continues to weaken, which adds color to this reading. Although conditions remain expansionary, the risk level remains elevated. As such, we are keeping this indicator at a yellow light.
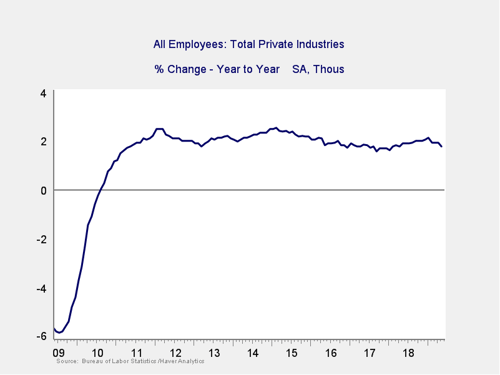
Private Employment: Annual Change
Signal: Green light
With a significant downside surprise to job growth in May, private employment growth pulled back again on a year-on-year basis, for the second time this year. Although it remains at healthy levels (at or above those of the mid-2000s), the growth rate has declined consistently so far in 2019, suggesting that the decline in the growth rate is now an established trend. Because this is an annual figure, the changes are slower and smaller than those we see in more frequently reported data.
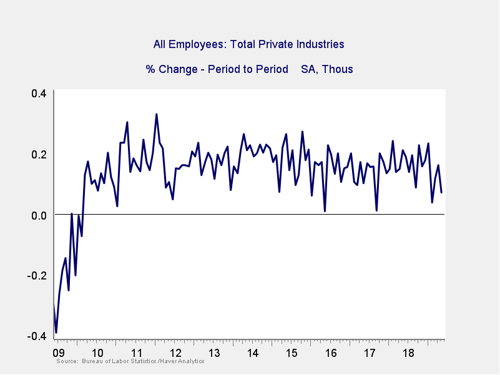
Private Employment: Monthly Change
Signal: Yellow light
These are the same numbers as in the previous chart but on a month-to-month basis, which can provide a better short-term signal.
After a weak February followed by two stronger months, May’s job creation was quite weak, well below expectations. Overall, the monthly results have been meaningfully weaker in 2019 than in previous years, which provides further evidence that the trend may be changing. The volatility of the monthly results, along with more frequent weakness, is an indicator that job growth may be weakening. As such, I am taking this indicator to a yellow light.
Yield Curve (10-Year Minus 3-Month Treasury Rates)
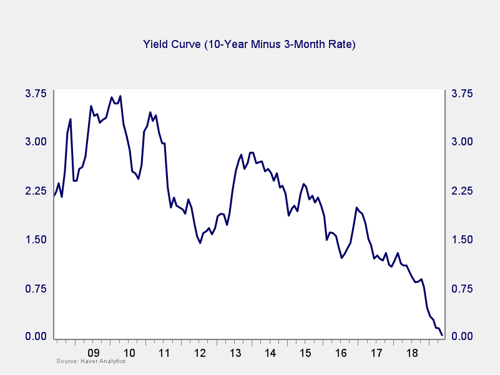
Signal: Yellow light (tending to red)
Rates closed last month at the closest point, on a monthly basis, to an inversion of the recovery, after a brief inversion during the month. Since then, rates have inverted fully, and that inversion seems to be holding. This is getting close to a recession signal but is not quite there yet. Given that the negative trend over the past couple of months has intensified, and the current inversion appears likely to last through the end of June, this likely marks a fundamental negative shift. Therefore, we are keeping this indicator at a yellow light but adding a shade of red. Should the inversion persist until month-end, this indicator will likely shift to red, but we are not quite there yet.
Consumer Confidence: Annual Change
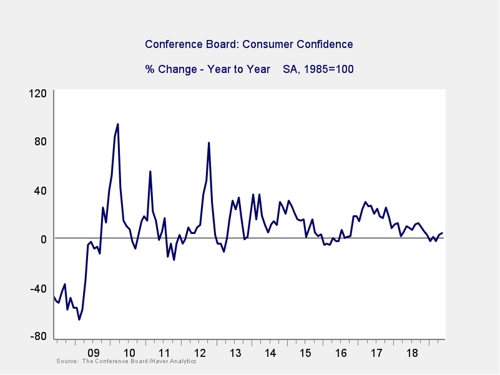
Signal: Yellow light
Confidence bounced back a bit further in May, keeping it close to recent highs and moving the year-on-year change further above the zero level, leaving it well above problematic levels. With the absolute level of confidence recovered and with the annual rate improving, this indicator has improved further. But the limited extent of that improvement, on top of the recent trend of a flat year-on-year change, suggests risks remain. As such, we are leaving it at a yellow light.
Conclusion: Risk remains elevated
Despite higher consumer and business confidence, we saw a decline in job growth and continued indicators of risk from the yield curve. These results suggest that while current conditions remain favorable, risks are increasing. The risk factors remain well out of the red zone, but some are getting quite close.
Although a continued slowdown remains the most likely case based on the data, a slowdown is not a recession—we likely still have several quarters to go there. Nonetheless, the bulk of the data indicates the risks of a worsening slowdown remain material (again, not yet as the base case). As such, I am leaving the overall risk level at a yellow light for the economy as a whole for June.