Print
PrintAs far as we know, the economic news remained solid if somewhat mixed last month. The caveat here is that the government shutdown delayed some reports. The core data we look at, however, is available.
Both consumer and business confidence pulled back further last month. Although they still remain at healthy levels overall, the risk is rising—especially for consumers. This decline was, however, offset by a second month of very strong job growth, which could help maintain consumer and business confidence going forward. The end of the government shutdown should also be a positive. Finally, longer-term interest rates, which had been a concern after Fed rate hikes and hawkish commentary, moderated as the Fed seemed to signal a pause in rate increases.
So, although there are some signs of slowing trends (notably in confidence), they are offset by continued strength in other key indicators. These conditions should support continued growth.
The Service Sector
Signal: Green light
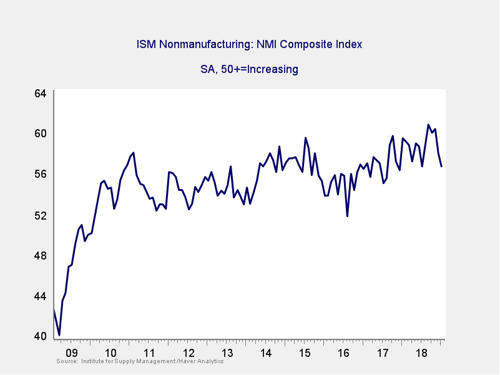
Business confidence rose to a 21-year high in September of last year. It has since pulled back, with a surprisingly large drop over the past couple of months. Despite the drop, however, confidence remains within the range of most of 2017 and 2018 and at a healthy level overall. This is a diffusion index, where values above 50 indicate expansion. So, the current level suggests that growth is likely to continue for the next several quarters. The indicator also remains consistent with the long-term trend line (as you can see in the chart above), suggesting that business confidence remains on an uptrend despite the recent decline—but the gap is closing. Although the risks are rising, with the current healthy level, this indicator stays at a green light.
Private Employment: Annual Change
Signal: Green light
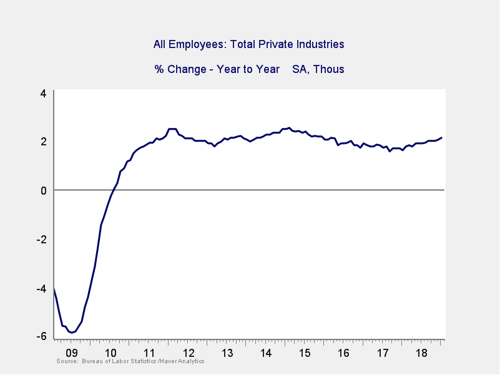
January job growth came in at 304,000, which was well above expectations for the second month in a row. Overall labor demand was even stronger, with the average weekly hours worked rising as well. The continuation of growth in the year-on-year trend, as shown in the chart above, suggests that labor demand remains strong and is likely to stay at a healthy level for the foreseeable future. As such, this indicator remains a green light.
Private Employment: Monthly Change
Signal: Green light
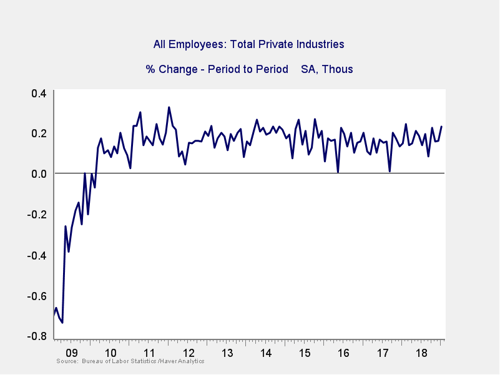
These are the same numbers as in the previous chart but on a month-to-month basis, which can provide a better short-term signal.
As noted above, January came in well above expectations. Although December was revised down, the average growth rate continued to rise. This result suggests that not only does job growth continue but that it is steadier than estimated. As with the other signals, and given the continued healthy long-term trends, this indicator remains a green light.
Yield Curve (10-Year Minus 3-Month Treasury Rates)
Signal: Green light
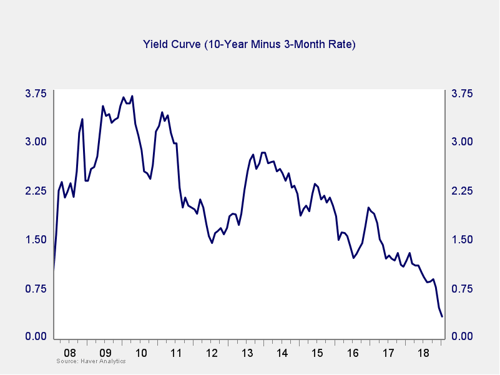
The spread between the 10-year and 3-month rates ticked down last month, as 10-year rates dropped back further after a spike. This decline in the spread takes us closer to the trouble zone, but it is still well away from it. In addition, lower long-term rates should also help growth. We are leaving this indicator at a green light.
Consumer Confidence: Annual Change
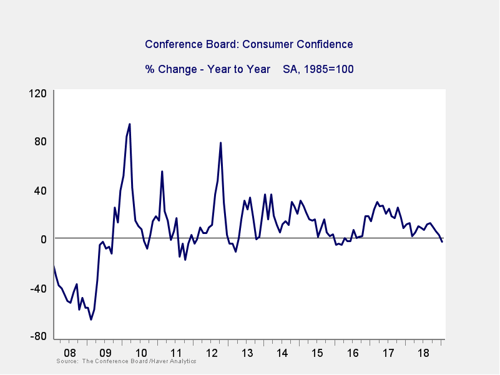
Signal: Yellow light
Consumer confidence pulled back in January for the second month in a row, from 128.1 to 120.2, on a further decrease in consumer expectations about the future. This drop took us below zero for the annual change for the first time since 2015, which is worrying. Further, the gap between current confidence and future expectations expanded to close to a record, which is also concerning. Although current confidence remains reasonably strong and the annual change is well above the trouble zone, risks have clearly risen—especially as the recent decreases may indicate further declines ahead. The current level suggests risks remain low, but the recent drops and growing gap between current and future suggest that immediate risk levels are creeping up. We are moving this indicator from a green light to a yellow light to reflect that shift.
Conclusion: Economy growing, some slowing but trends still positive
All four indicators remained positive on an absolute basis, and the data continues to be healthy. Although signs of weakness in confidence bear watching, recent improvements in hiring after a period of relative weakness suggest that present conditions remain favorable overall.
The economy gets a green light for February.