Print
PrintThe primary worry over the past month has been employment: was the very weak February job number a one-off or a sign of something worse? Fortunately, it looks like the former, which eases the primary risk. Unfortunately, we saw the other risk factors continue to trend down, suggesting that the economy might well be slowing even more than expected. Here, one key point at month-end was the brief inversion of the yield curve, which raised concerns.
But slowing is still growing, and all the risk factors remain well out of the red zone. So, growth is likely to continue. That said, apart from the rebound in job growth, the metrics have continued to decay—and the risks are rising.
The Service Sector
Signal: Green light
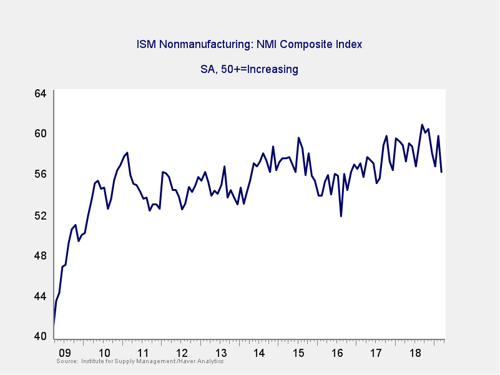
As a representative sample of the largest sector of business, this is an important leading indicator. It dropped back again last month but remains well within expansion territory and within the range of the past two years. As such, there is support for the idea that the service sector remains solid despite being pulled down by weakness in manufacturing. Although the indicator is below levels of the past year or so, it remains healthy, and we can expect more business and employment expansion. Continued strength in the service sector is consistent with business confidence.
Private Employment: Annual Change
Signal: Green light
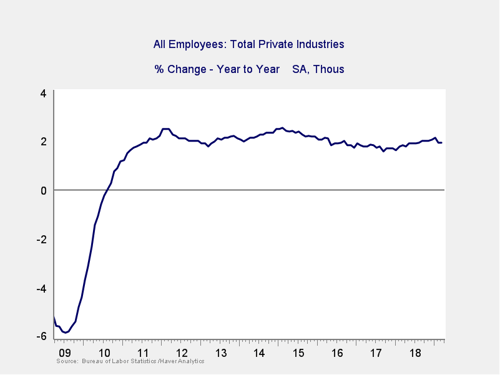
Private employment growth year-on-year steadied, after a pullback on February's weak job creation number. It remains at healthy levels (at or above those of the mid-2000s), suggesting that the decline in the growth rate has stabilized for the moment. Because this is an annual figure, the changes are slower and smaller than those we see in more frequently reported data, but the trend continues to be positive.
Private Employment: Monthly Change
Signal: Green light
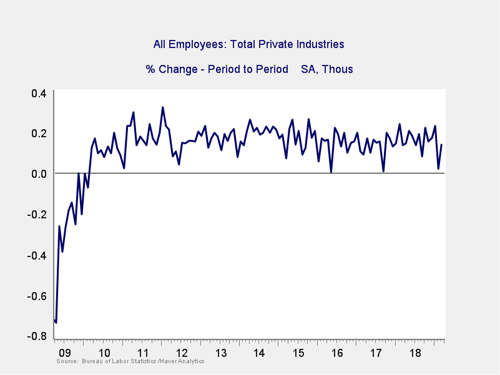
These are the same numbers as in the previous chart but on a month-to-month basis, which can provide a better short-term signal.
February job creation was quite weak, but the March number was much stronger. This rebound indicates that employment growth continues at a steady pace and alleviates some of the concern for this indicator. Total employment growth remains healthy, within the range for this recovery.
Yield Curve (10-Year Minus 3-Month Treasury Rates)
Signal: Yellow light
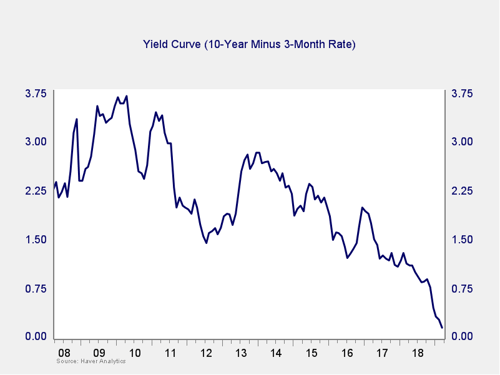
Rates dropped last month for both the 10-year and 3-month Treasuries, taking the spread down close to zero. Indeed, the spread dropped below zero for a couple of days at month-end, before rising again. Although there was a brief inversion, it doesn’t show on the monthly chart. The trend over the past couple of months has changed from positive to negative, and it has now extended long enough to suggest this is likely a fundamental negative shift. The brief inversion is not a sign of imminent trouble, but it certainly raises the risk level. Therefore, I’m taking this indicator from a green light to a yellow light.
Consumer Confidence: Annual Change
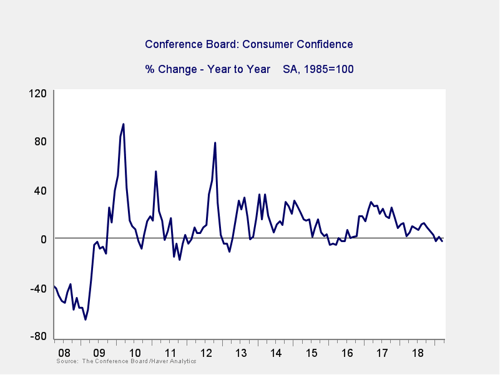
Signal: Yellow light
After last month’s bounce, consumer confidence decreased again this month. Further, the year-on-year growth rate declined slightly, taking it back below zero on an annual basis. The year-on-year growth rate remains well above problematic levels. But the current return to a below-zero level (despite recent positive news) suggests this metric continues to signal higher risk. As such, we are leaving it at a yellow light.
Conclusion: Signs of rising risk
With the brief inversion of the yield curve and the drop in consumer confidence, two of the major indicators are now at yellow light status. This suggests that recent downward trends are continuing and possibly even worsening. Although job growth has rebounded and business confidence remains healthy, even there, the risks have risen based on recent events.
Although a continued slowdown remains the most likely case based on the data, a slowdown is not a recession—we likely still have several quarters to go there. Nonetheless, the bulk of the data indicates the slowdown may be deepening.
Overall, the risks seem to be rising or, at best, holding steady, and they appear more threatening and immediate than they did last month. Because of that, I am taking the overall risk level down to a yellow light for the economy as a whole for April.