

 Print
Print The past week has seen the case growth rate remain low. But there are signs that the case count may be rising, as post-Labor Day infections start to register and as schools and universities reopen. While the pandemic remains under control, the steady improvement in both the case growth rate and case growth itself has paused and may be starting to falter. While the control measures are still working, conditions are changing.
At the national level, as of September 17, the daily spread rate is 0.6 percent per day, up slightly over the previous week. The seven-day average of the daily number of new cases was up to just under 39,000, from just over 37,000 last week. While case growth remains well below July and August levels, the continued improvement has paused.
The testing news was similar. The number of tests bounced around over the past several weeks, but it has remained generally steady at around 700,000 per day. This testing level is likely insufficient, but with the drop in new and active cases, the positive testing rate has continued to decline and is now around the recommended 5 percent. This is a metric that will need to improve; nonetheless, signs are it may be sufficient at the moment to keep the virus under control.
Beyond the headline numbers, state-level data is generally good, although concerns remain about states in the Midwest. Overall, the national risks remain under control.
With the medical news better, the economic recovery remains on track, albeit with some areas of concern. One worth watching is consumer confidence and spending, with signs of weakness. Financial markets continue to show turbulence, as investors process the headlines. Let’s take a look at the details.
Pandemic Growth Rate Still at Low Levels
Growth rate. The daily case growth rate has risen slightly, ending the reporting period at 0.6 percent per day, up from 0.5 percent per day the previous week. The rise in the spread rate is small, but it suggests that the medical effects of the Labor Day gatherings, as well as school and university reopenings, may be starting to show in the data. That said, this is still very close to the lowest growth rate so far in the pandemic and leaves the infection curve flat at a national level, with low risk to health care systems.
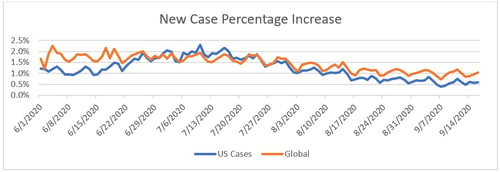
Source: Data from worldometer.com
Daily testing rate. As infections have dropped, testing remains steady although variable, and it has stayed in the range of around 700,000 per day. This appears to be below the level of testing needed to develop a full understanding of the pandemic, despite the recent improvements in the spread rate.
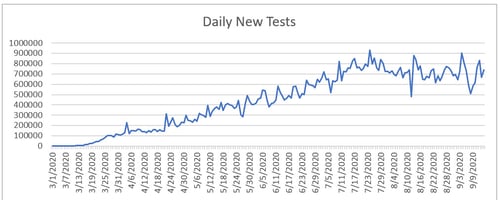
Source: Data from the COVID Tracking Project
Positive test results. That said, the positive rate on tests remains around 5 percent, which is close to an acceptable level. If we look at the percentage of each day’s tests that are positive, lower numbers are better, as we want to be testing everyone and not just those who are obviously sick. The World Health Organization recommends a target of 5 percent or lower, which we are getting close to achieving again. If the case growth rate remains low, the pandemic spread may be approaching the level where current testing is adequate.
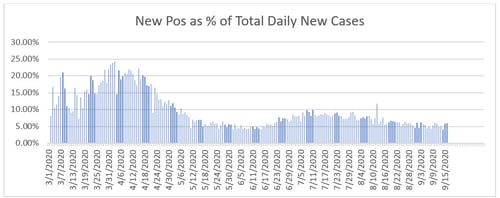
Source: Data from the COVID Tracking Project
New cases per day. The most obvious metric for tracking the virus is daily new cases. Here, we see more signs that Labor Day gatherings, as well as school and university reopenings, may be increasing viral spread. The seven-day average number of new cases per day rose from just over 37,000 per day last week to just under 39,000 per day. This is a reversal of the improvement seen in previous weeks, and it will need to be watched.
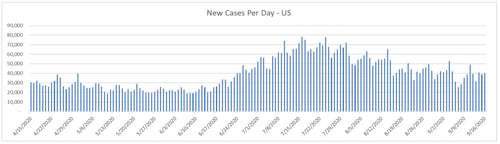
Source: Data from worldometer.com
Total active cases. That said, a positive development is that as the number of new cases has slowed, the number of active cases has stabilized and even shown signs of declining. If case growth remains stable, new infections will continue to lag recoveries, and the number of active cases would continue to decline, which would be a very positive sign.
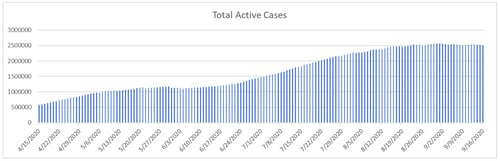
Source: Data from worldometer.com
Overall, the pandemic is under control at the national level. But improvement has paused, and there are some signs of increased viral spread. At the state level, the health emergencies have largely passed, although concerns remain in some states. The good news here is that policy and behavioral changes have taken effect, as they did in the first wave, and that while risks are rising, we still largely have the virus under control.
Looking forward, the question is whether the improvement will continue into the fall. As noted above, the recent Labor Day holiday gatherings, combined with the ongoing reopening of school districts and universities, may well have increased the spread rate based on the most recent data. Given the lags between infection and detection, if that is the case we still have several weeks to go before the full effect will be seen, so the risks remain material. These will be something we need to watch.
Signs of Slowing in Economic Recovery
Jobs market. The economic news is also showing signs of weakness. While the recovery continues, there are signs of slowing. The good news is that the most recent initial jobless claims report shows slightly lower layoffs, and the continuing unemployment claims have also declined—showing that after last week’s weak reports that improvement has resumed. Improvement in the jobs market has been a relative bright spot, so it is good to see improvement resuming.
Consumer spending. Consumer spending has weakened. In the past two weeks, spending dropped from within 3.2 percent of the pre-pandemic level to 7.3 percent below. Consumer confidence has also shown declines. Much of the decline in both confidence and spending appears to come from lower-income workers, who are most affected by the expiration of federal income support payments and where the jobs recovery has been particularly weak. This metric remains something to watch.
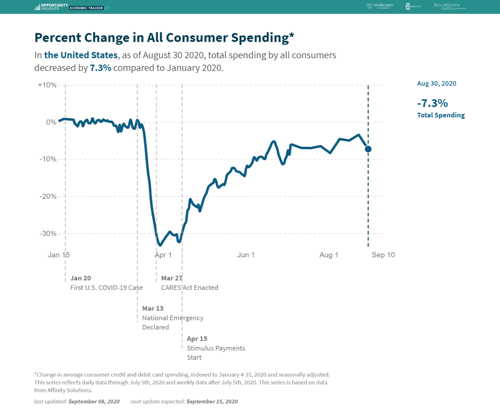
Source: https://tracktherecovery.org/
Business sector. Even as there are signs of weakness in the consumer economy, the business sector continues to do well. Business confidence and investment are largely back to pre-pandemic levels. Further, specific higher-frequency indicators are showing improvement in many cases, as we can see in this composite of many of these indicators from J. P. Morgan.
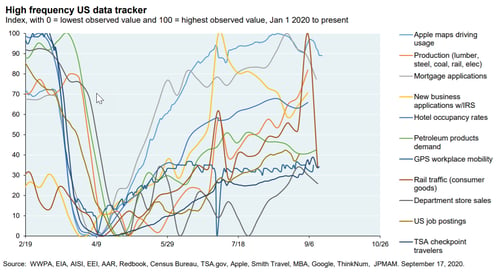
Source: J. P. Morgan
The big picture is that the recovery is still on track but that signs of weakness bear watching. If the medical risks continue to rise, the economic risks will as well.
Financial Markets Show More Turbulence
Financial markets rallied last week only to hit more turbulence on rising worries about just how durable the economic recovery was. Given the data we reviewed above, those doubts seem reasonable, which suggests we might see more volatility ahead. That said, the fact that both the medical and economic risks are still relatively low should continue to provide support.
Risks Coming into Focus
The real news this week is that the pandemic remains under control, although as noted, medical risks are starting to rise again. The effects of the Labor Day holiday exposures and school reopenings are starting to appear in the data, and we have a couple of more weeks to go until the full effects will be apparent. This will need to be watched.
The economic risks are also real, and we do see some slowing in the recovery so far. That will also need to be watched, especially if the medical risks rise. But at the moment, the recovery continues, and there is a real possibility it will accelerate again if the medical risks remain constrained or, especially, if another federal income support program is passed. The risks are real, but so are the opportunities.
Finally, markets continue to be turbulent as investors process the different risks and while more volatility is quite possible. But the fact that, as of now, the medical risks remain contained and the economic recovery continues should provide support.
Given all of this, over the next couple of weeks the most likely case appears to be some deterioration of the medical news (although likely to a limited degree) and continued slow improvement on the economic fronts. While there are certainly risks coming into focus and we need to be aware of them, for the moment, the news remains good.


