

 Print
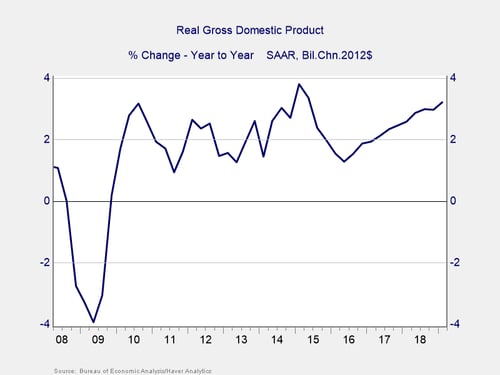
Print This morning, we got the first estimate of economic growth for the start of the year. Despite quite a bit of concern about slowing growth, the figure came in at 3.2 percent. This result was well above the expected 2 percent and a substantial acceleration from the 2.2-percent gain in the last quarter of 2018.
In fact, this is the highest annual growth rate since the second quarter of 2015, as you can see from the chart below.
On the face of it, this figure seems to suggest that not only does growth continue but that it actually may be accelerating. Unfortunately, the details are not nearly as cheerful as the headline and suggest this past quarter may well be as good as it gets for the economy this year. The economy consists of four major sectors: consumer spending, business investment, government spending, and net exports. A look at all four will explain what I mean.
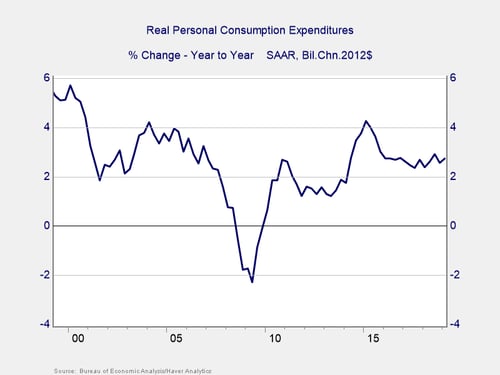
Consumer spending
Consumer spending grew at 2.74 percent over the past year. This growth is not bad, except it has not really accelerated at all over the past couple of years and is well below the 4-percent growth we saw the last time overall growth was at current levels. Clearly, the consumer was not the driver for last quarter’s faster growth.
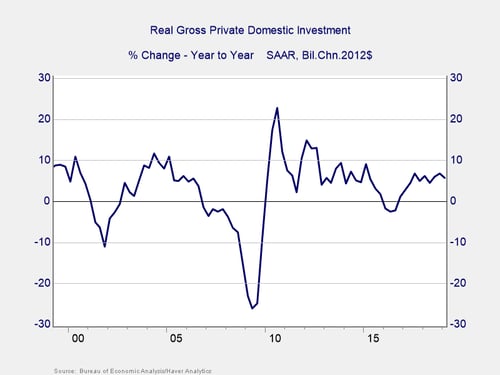
Business investment
Business investment is doing better than consumer spending growth. But it has also been reasonably steady over the past couple of years, with no acceleration to explain why the most recent data is so strong. More, when you compare the figures between the past quarter and the second quarter of 2015 (when we last saw similar growth), they are almost identical and don’t explain the current surge either.
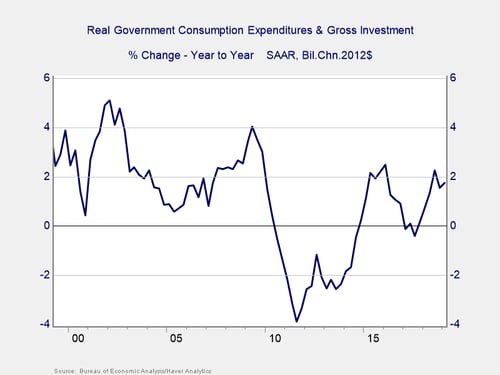
Government spending
Government spending, on the other hand, has been accelerating and can account for some of the faster growth. With overall government spending growth up from flat to 2 percent or so, this jump explains a big chunk of the upside surprise.
Net exports
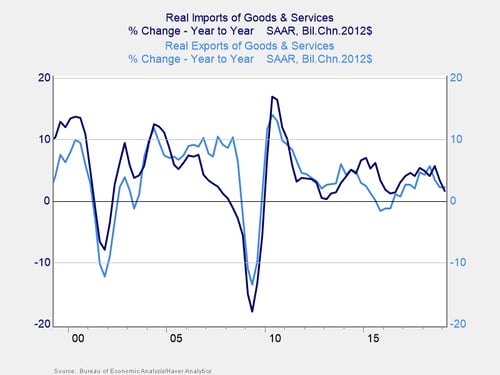
And looking at the balance of trade explains most of the rest. Although both imports and exports are down on an annual basis, you can see that imports have declined more during the most recent quarters, which gives a boost to domestic growth. Much of that decline, however, is due to the ongoing trade conflicts between the U.S. and other countries, rather than a fundamental economic improvement. When the trade conflicts are resolved, so too could the trade balance return to normal.
Putting it all together
Overall, that great 3.2-percent gain in the first quarter actually came largely from an improvement in the balance of trade (1 percent), as exports increased and imports contracted over the past quarter. On top of that, companies increased inventories in unusual amounts last quarter, which accounted for another 0.7 percent of the gain. These two components normally offset each other, so this improvement should reverse over the next couple of quarters and is almost certainly not sustainable.
The other unusual piece here, as noted above, is government spending. There was a surprising spike in spending at the state and local level, largely on highways, which looks to be unusually seasonal and, again, not sustainable.
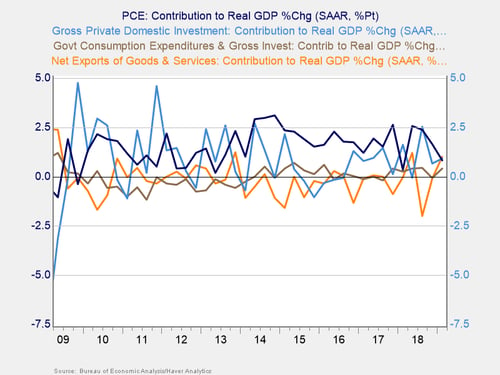
Looking at the chart below, you can see that consumer spending and business investment, normally the two largest contributors to growth, turned down. But the two areas that generated most of the gains last quarter, net trade and government spending, are much higher than normal. Growth last quarter was unusual in its composition and may not be representative of the future.
Blue skies ahead?
Future growth, therefore, depends largely on whether consumer spending and business investment recover and whether the trade balance and government spending stay at current levels. The signs for the first are better, as the retail sales report came in strong last month, so we can likely expect continued growth. The prospects for the other three components are weaker, however, suggesting that growth will likely be slower.
Big picture? A good report, but likely not a harbinger of much faster growth this year.


