

 Print
Print Several weeks ago, an advisor asked me to take a deep look at debt in the economy. I thought this was a great idea, both timely and important. In fact, I meant to get to it sooner but, well, things happened. When I did start to investigate, I realized that “debt” was many different topics, deserving of several posts. So, here we are, beginning a series that will resume in January. Fortunately, the news is not actually all that bad in most areas. Even in the ones where it is very bad (e.g., U.S. government borrowing), there are reasons to, if not be cheerful, than at least not to despair.
In the spirit of the holiday season—when we are all out spending money on gifts for loved ones—I want to focus on consumer debt. This is what much of the more apocalyptic coverage focuses on, with particular attention to student loan debt and mortgages. While there are reasons to be concerned, there are also solid reasons that we are still in a low-risk place, economically, as far as consumer debt goes.
Household debt
Let’s start with the reasons to worry: total household debt has tripled in the past 20 years and is now above the peak we saw in 2007, just before the crisis. This looks like a problem in the making.
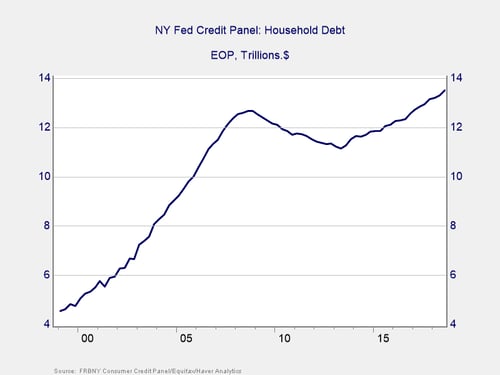
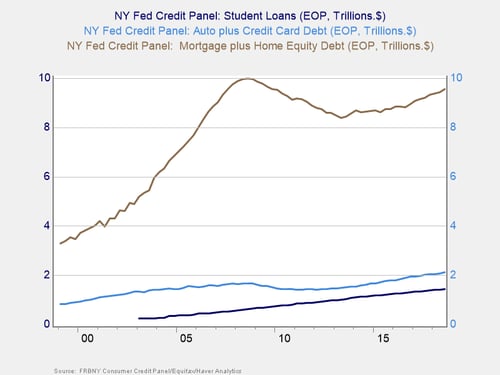
When we look at the details, though, things get a bit clearer. Real estate loans, shown in the aggregate below, are below the 2007 level, despite the overall increase in property prices. Consumer loans are higher but modestly, given the overall increase in wage income. Of course, student debt is up, but it is a fairly small part of the total debt pool. Big picture? Consumer debt is up, given the increase in wage income and property values, but it is well below the 2007 levels once you adjust for these factors.
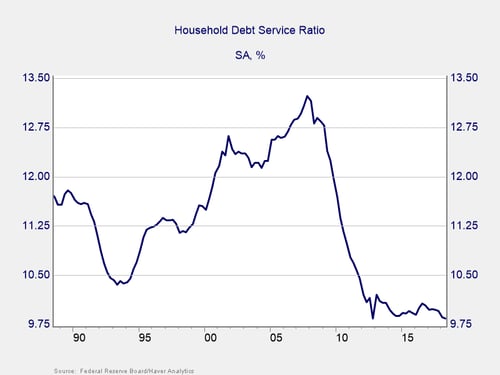
Debt service ratio
The absolute level of debt is also not the most important issue here. What matters from an economic perspective is the ability of borrowers to pay—and how much they are paying. Here, the news is actually good. Interest rates are low, and mortgages (many of which are locked in at low rates) make up a large proportion of consumer debt. As such, the debt service ratio (i.e., debt service divided by disposable personal income) is at the lowest level of the past 30 years. Consumers have a lot of debt, but they (in aggregate) can very easily pay for it. If wage growth accelerates, that payment will only get easier going forward. That scenario will change over time, if rates go up. For the moment, however, actually paying for the debt is not a problem.
We can also see this picture in the default stats. Right now, just over 95 percent of all account balances are current, which is right in line with 2004–2005. While we may start seeing a downturn here, there is no sign of immediate stress.
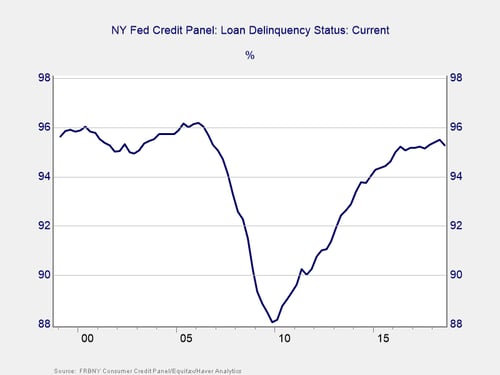
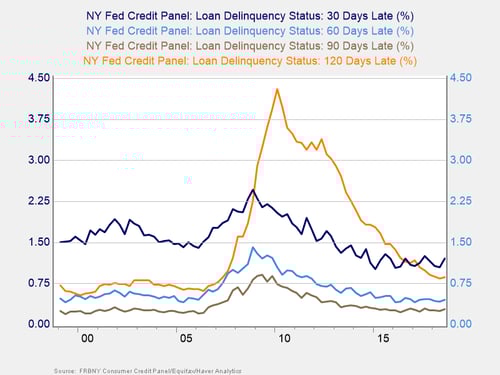
When we look at late statistics, we see the same thing. Long-term delinquencies have been level or declining for the past couple of years, while shorter-term delinquencies have been level and low. The macro stats say consumers don’t have a problem with debt, and the actual delinquency numbers support that as well.
The spirit of the season
Now, this is not to say there are no areas of trouble—there are. But from a systemic perspective, the risk from consumer debt is minor. In fact, consumers are well able to continue spending. And according to the recent retail sales reports, that is just what they are doing, in the spirit of the holiday season.
The news will not be as good in the corporate and government debt areas. We will take a look at that early next year.


