 As we approach the end of 2017, I have been thinking a lot about 2018. Right now, there is quite a bit of good news out there. Hiring continues to be strong, people are earning and spending more, business investment is finally picking up, and the rest of the world economies have started growing again. And, of course, stock markets around the world have done very, very well in 2017.
Looked at that way, it would suggest that 2018 is likely to be even better—and that is exactly what people seem to expect. The Conference Board’s survey of consumer confidence came out today. It was expected to drop slightly from very high levels. Instead, it moved up even further, to a 17-year high. While consumers’ assessment of current conditions went up, most of the improvement came from better expectations for the future. People really do expect things to keep getting better.
How high can confidence go?
This confidence should be a self-fulfilling prophecy. As consumers feel better, they spend more, and the economy grows faster. This is what we have seen for the past several years, and it works. At some point, however, that confidence peaks and spending power is exhausted. When confidence rolls over, the process goes into reverse. With confidence at a 17-year high, just how much higher can it go?
We have limited data to answer this question. But what we do have is fairly recent and—given the consistency of the survey—fairly reliable.
A closer look at the numbers
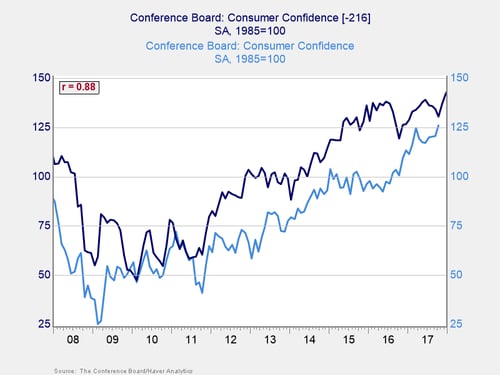
In the chart below, you can see the current confidence number (in light blue) and the lagged confidence number (in dark blue) set to make 2017 equal to 1999.

Two things jump out at me from this chart. First is the high correlation (0.88). In terms of economic statistics, that is almost identical. For the confidence trend over the past decade to be that close of a match to the 1990s, ending in 1999, suggests something similar is very likely going on.
The second thing I see is that although confidence is now at a 17-year high, it can still go higher. How high? No one knows, but the peak level of the dot-com boom, at just under 145, seems like a reasonable top number. That is also the highest number ever observed, in data going back to 1967. So, let’s call 145 the upper limit here.
With consumer confidence now at around 126, we have 19 points of upside to go. Looking at the data, when confidence starts rising again, it takes about a year to rise 20 points (per 2013–2014 and 2016–2017 on the chart). With all of the good news I mentioned above, it doesn’t seem unreasonable to see confidence rise for another year or so—and that would take us close to the upper limit.
Keep watching the data (not the date)
When we look for the end of the cycle, we need to watch the data carefully. I am on record as saying that 2017 looks a lot like 1999 and that we might be headed for trouble in late 2018. This is an argument based on data, not the date. Looking at the above data, however, that 1999 comparison might be premature. From where we are now, it took two years to hit the peak, not one. We may have more time in the cycle than I initially thought.
You know what? That’s fine by me. In fact, it never really was about the date—although that sure made for a great story line—but about the data. Right now, the data shows that confidence is likely to peak a year out, but it could be longer.
Then again, as you can see above, we are not out of the woods yet for 1999 either. As always, we will keep watching the data. That, not the date, is what really matters.


 Print
Print

