

 Print
Print Now that we’re two years into the pandemic, analysts have a lot more context than we did at the start. We have seen multiple waves of the virus, have watched the economy react in real time, and have a sense of what the policy responses are likely to be. As such, we could look back on history for some guidance as to what was likely to happen with the winter Delta wave—and that guidance by and large worked.
Enter Omicron
And then came Omicron. As one of the most contagious viruses ever, the case growth blew through all previous data. As a potentially (but not necessarily) milder variant of Covid, the medical damage was in question. At the intersection of the two, the direct economic damage from hospitalizations and people being forced to take time off from work was in question as well. As the most recent wave took off, there was a real possibility that we could see economic damage of the same magnitude as that of the first wave. That certainly was not the base case, but it was a plausible outcome.
While there are still many uncertainties, the most recent data has started to rule out that extreme case. Signs of the virus spread appear to be peaking across the board here in the U.S., and we have other countries that had the same experience to validate those indications. While the likelihood is for sustained medical and economic damage, that damage now looks likely to be no worse—and quite possibly not as bad—as the two Delta waves.
So, Where Do We Go from Here?
Case growth. Let’s start with where I think we may be heading. South Africa has been held up as a model of where we might be going. As the chart below shows, we can only hope that theory is correct. The Omicron wave, on the right side of the chart, started out much sharper than prior waves, but then it ended up collapsing much faster as well. Here in the U.S., we have had the same sharp increase in case growth, but the unanswered question is whether we will have the same sharp drop in case growth.
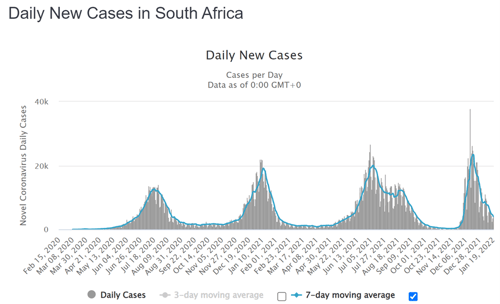
Source: https://www.worldometers.info/coronavirus/country/south-africa
At the national level, we haven’t yet seen that drop, but we do see what looks like a peak. Our peak looks to be a couple of weeks after the South African one, which aligns with how the variant seems to have spread and suggests the dynamics may be the same. Looking at individual state data, we also see the same thing, with case growth in New York, Massachusetts, and other states down by one-third in the past week or so from the peak. While the virus has spread through the U.S. at different rates, the areas that were exposed earliest are starting to drop, which suggests the country as a whole will do so in the next couple of weeks. As the chart shows, that may already be happening.
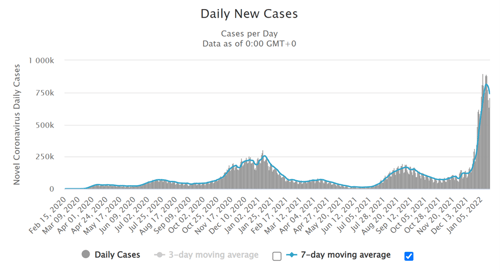
Source: https://www.worldometers.info/coronavirus/country/us/
Positive test rates. It’s not just the case growth that appears to have peaked, either. Positive test rates appear to have peaked on the same time frame as case growth. While hospitalizations lag the case count data, there are initial signs they may have peaked as well. So, while real risks remain, so far the virus is behaving as an optimist would have expected it to based on the South Africa data. From a medical standpoint, it now seems very possible the Omicron wave will be sharp—but short.
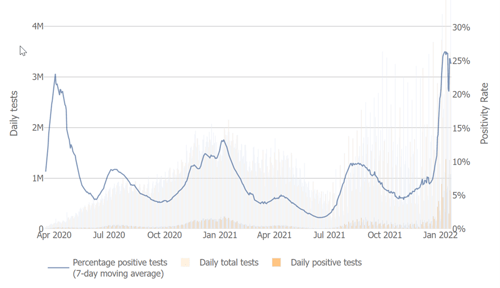
Source: Johns Hopkins University
Assessing the Economic Damage
From an economic standpoint, this matters a lot. What drove the economic damage of the first wave was the uncertainty about how bad it could get and how long it would last. We simply didn’t know either, and policy was designed on that basis. Now, if the South Africa trend holds, we know it will be really bad (and it is), but we also know it might not last that long and will improve rapidly. If that is the case, the economy simply has to wait it out, which won’t take that long, before resuming recovery.
There is damage, of course. Layoffs have moved up again, job growth looks to have slowed, and spending is likely to take a hit as well. But if we can move past this in a couple of months, it will be a blip on the recovery and not anything worse. And that is where we seem to be.
End in Sight?
We have seen the virus fool us before, of course, and it could still get worse. But we now have the data to say that does not seem to be happening. For the first time in this wave, once again, we can see what may be the end.


