

 Print
Print In the past couple of days, I have gotten several questions regarding my assertion that there were signs that the spread of the virus has been stabilizing and even showing signs of improving. With headlines shouting about the rising number of cases and a health system under threat, the real question is, how can I make that statement?
Let me be clear. I read the newspapers, too. I see the headlines. I understand where the questions come from. The situation is terrible, and as long as the case count keeps rising, it will get worse. In that sense, things are not improving.
But when we simply leave it at that (i.e., as long as the case count is rising, there is no end in sight), it doesn’t help us understand the situation. What I want to talk about today is how I am trying to get underneath the rising case counts to discern whether things are really getting worse or, as the data shows, starting to get less bad. Here, less bad is a better descriptor than good, so let’s go with it. Less bad is still an improvement, however, which is what I have been talking about here.
Why growth matters
It all comes down to how a virus spreads. When we talk about a meme or video going viral, we mean it spreads rapidly and explosively—or, as the term goes, exponentially. So, what do we mean when we talk about exponential growth?
The fundamental idea here is that exponential growth is different from linear growth. Let’s say something grows at 10 units per day. If you start with 100 units, then in a week you will have 170 units, and in a month (with 30 days) you will have 310 units. Steady and linear.
Exponential growth doesn’t work like that, because it is a constant percentage rate. If you take the same 100 units to start and grow at 10 percent per day, then in a day you will have 110 units—the same as linear growth. In a week, you will have 195 units, as compared with 170 units for linear growth, which is a sizable difference. In a month (with 30 days), you will have 1,745 units—a great deal more than 310 units.
The faster the rate of growth, the greater the impact. At 20 percent per day, in a week you will get 360 units, compared with 195 units for 10 percent growth (170 units for linear growth). In a month, you will have 23,738 units, compared with 1,745 units (310 units for linear growth). Higher growth rates mean many, many more cases in a fairly short period of time.
This is why the growth rate matters: it determines how many cases we have in a week, a month, or a year. Even small declines in the growth rate can make a very big difference in the future number of cases. When the growth rate is rising, the future cases are exploding. And when it is falling, the future cases will be less, potentially much less. This is the math behind flattening the curve and social distancing—to slow that spread rate to a point where future cases grow much more slowly or even start to shrink. Note that, even if the growth rate drops from 20 percent to 10 percent, we still have a lot of new cases. But the improvement is very real over what might have been.
For just this reason, the growth rate in cases is what I have been watching. While the number of cases is still rising quickly, the growth rate is what tells us where we will be in a week and a month—and how much worse it will be.
Are we seeing progress?
The chart below shows the daily growth rate in new cases for the past several weeks. Note that the U.S. growth rate, although bouncing around, has been steadily declining, with significant progress in the past couple of weeks. The growth rate as of the past couple of days is half what it was earlier in the month. This data is what I am talking about when I say there is real improvement, even though the case count continues to rise. The drop in the growth rate, if sustained, tells us that the future caseload will not be as bad as it might have been. This is progress, and slowing growth is a necessary first step to stopping new cases altogether.
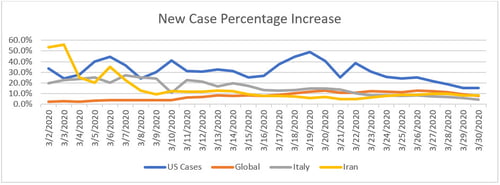
Source: Data from Worldometer
Another way of seeing that progress is to look at the number of new cases. Two days ago, we saw the first decline in the actual number of new cases over the previous day. Even though the base number of cases was higher, the spread rate dropped enough to take the number of new cases down. This is real progress.
Fewer new infections is far way from no new infections, which is where we need to be. We still have a long and painful slog ahead. At the same time, these numbers show that the pain we are now undergoing is indeed having a positive effect and that we are moving in the right direction.
This perspective is what I have meant when I say there are signs of real progress—because there are. We know what must be done as a society, and we are doing it. The current situation is terrible, and it will get worse. But even as the number of cases rise, the trend is in our favor.
The end of the beginning?
This is not the beginning of the end, but it could well be the end of the beginning. That is a mangled quote from Winston Churchill, one of my heroes, and I will close with another. “When you are going through hell, keep going.” We will keep going and get through this. This is a real crisis, and the damage and pain are not over. But at least we have the consolation that we are indeed making progress. Things are less bad than they might have been, and that is the first step to actually making this situation better.


