

 Print
Print The good news is that the second wave of infections has continued to come under control in the past two weeks. Case growth is down significantly from the peak, and the case growth rate has ticked back down below the lows seen in mid-June. Despite the higher case counts, the pandemic is once more under control. The control measures are working.
At the national level, as of August 27, the daily spread rate is now down to 0.7 percent per day, and it has been below the mid-June growth rate of around 1 percent for the past nine days. The seven-day average of the daily number of new cases was about 43,000, down from 55,000 two weeks ago. If this trend continues to hold, the pandemic will remain under control, with a higher infection level than we saw six weeks ago but one that could reach mid-June levels in the next several weeks. This shift is a significant improvement over mid-July.
The testing news is less good. The number of tests has trended down further over the past two weeks, from in the 700,000s two weeks ago to the mid-600,000s in the past week. The decline in tests has not been because of a slowdown in infections, as the positive rate has held at more than 5 percent. This is a metric that will need to improve to keep the virus under control, and the recent data is moving in the wrong direction.
Beyond the headline numbers, state-level data is generally good. Case growth in the worst-affected states, including California, Florida, and Texas, has declined significantly over the past two weeks, as people and governments there have started to reimpose social distancing and other restrictions. While there are concerns about states in the Midwest, these changes show that policy measures are succeeding in constraining further increases. Overall, the national risks remain under control.
With the medical news better, the economic recovery remains on track. The job market continues to improve and spending is holding up, although signs of declining confidence are something to keep an eye on. Plus, financial markets continue to move higher in response to the positive developments. Let’s take a look at the details.
Pandemic Growth Rate Down
Growth rate. Over the past two weeks, the daily case growth rate has ticked down from 1 percent to 0.7 percent per day, and the past two weeks also showed the lowest level of the pandemic thus far. Even as the case count remains elevated, the spread is slowing. At this rate, the case-doubling period has risen to about 15 weeks, up from 10 weeks. This leaves the infection curve flatter at a national level, and most states are now at the lower spread rates, which limit the risk to their health care systems.
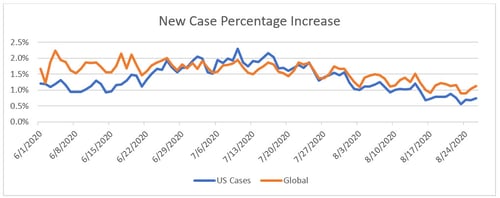
Source: Data from worldometer.com
Daily testing rate. Despite the rise in infections, testing rates have decreased, from more than 700,000 per day to the mid-600,000s per day, with the most recent data showing a continued drop. This is well below the level of testing needed to develop a full understanding of the pandemic, despite the recent improvements in the spread rate.
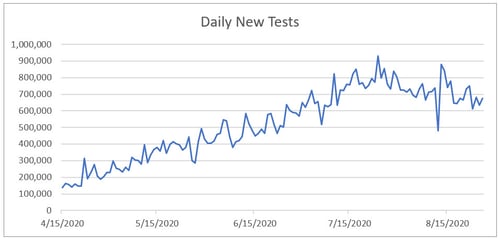
Source: Data from the COVID Tracking Project
Positive test results. We can see this lack of progress by the positive rate on tests. If we look at the percentage of each day’s tests that are positive, lower numbers are better, as we want to be testing everyone and not just those who are obviously sick. The World Health Organization recommends a target of 5 percent or lower; the lower this number gets, the wider the testing is getting. Here, we can see that the positive level has remained well above that target. This data shows that we are largely just testing the people who are sick, which is insufficient to keep the pandemic under control.
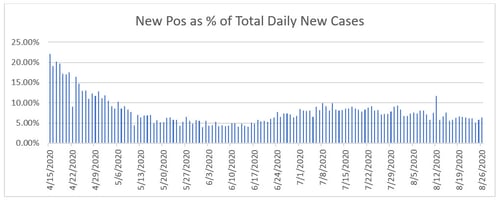
Source: Data from the COVID Tracking Project
New cases per day. The most obvious metric for tracking the virus is daily new cases. With increased control measures in place, especially in the outbreak states, the seven-day average number of new cases per day has dropped from 55,000 per day two weeks ago to around 43,000 per day. While this is above the rate of mid-June, the downward trend could take us back to that level in the next several weeks, if it continues.
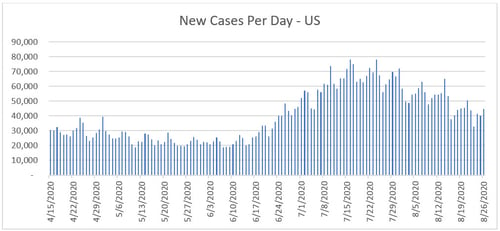
Source: Data from worldometer.com
Total active cases. One very positive development is that as the number of new cases has slowed, the number of active cases has stabilized over the past two weeks. If case growth continues to decline, new infections will start to lag recoveries, and the number of active cases would actually decline, which would be a very positive sign.
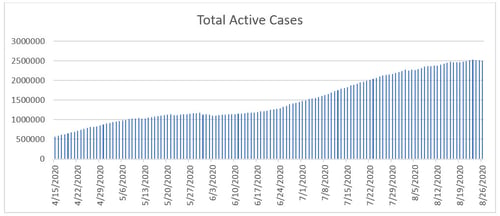
Source: Data from worldometer.com
Overall, the pandemic is under control at the national level, and it continues to improve. At the state level, the health emergencies have largely passed. The good news here is that policy and behavioral changes are taking effect, as they did in the first wave, and that we have largely contained the virus as we did then. The risk of a national shutdown is now quite small.
Looking forward, the question is whether the improvement will continue into the fall. The trends are very positive. But given the reopening of school districts and universities, as well as the fact that as risks fade so does the incentive for people to maintain control measures, those risks remain material. This situation will be something we need to watch.
Economic Recovery Stable, But Showing Signs of Potential Weakness
The economic news is also good, with the recovery continuing. The most recent initial jobless claims reports remain below recent levels, and the continuing unemployment claims have also improved. Stabilization in the jobs market remains a relative bright spot as businesses continue to figure out how to operate under the constraints of the pandemic.
Signs of weakness. That said, there are signs of weakness. Consumer confidence has ticked down again, back to the lows it saw earlier in the pandemic. This decline comes on the expiration of federal income support payments and despite the improvement in the medical news. Looking forward, medical risks might not be the key issue. Instead, spending and the recovery look to depend to some extent on whether further federal unemployment insurance support is provided.
Spending improves. On a more positive note, however, despite the decline in confidence, higher-frequency spending data has improved over the past two weeks. While the risk from lower confidence is real, so far at least it has not affected spending. This risk will be something to watch, however.
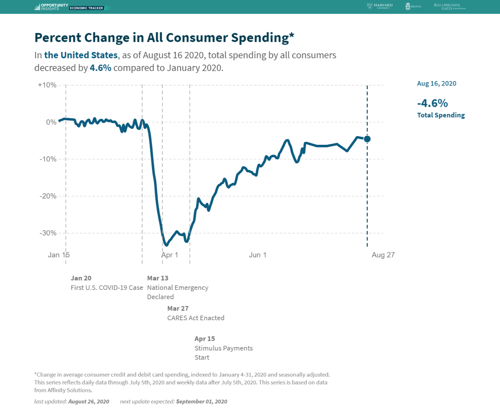
Source: https://tracktherecovery.org/
Finally, we can see similar signs of a moderation in general, and a slowdown in some specific sectors, in this composite of many indicators from J. P. Morgan.
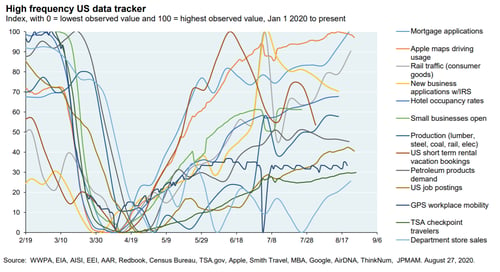
Source: J. P. Morgan
Although the recovery is still on track, and the medical risks have improved significantly, the economic risks are becoming more apparent. The biggest is that much of the confidence and spending recovery was due to federal income support. If that is not renewed, we could see further declines. While the slowdown so far has been limited, a deeper drop remains a risk.
Financial Markets Approach New Highs
Financial markets have appreciated steadily over the past two weeks in response to the positive news. On the medical front, markets have responded to the improvement in the new case count and encouraging news on vaccine development. On the economic front, corporate earnings are coming in better than expected. Overall, markets remain supported by ongoing positive developments, but they are very aware of the risks. The good news is that as we get more data, markets seem to be developing a firmer foundation.
The Risks Are Real
The real takeaway for this update is that the second wave has now largely been brought under control, just as the first wave was. The medical risks are now contained, although further future improvement is not guaranteed. The economic risks, however, have risen somewhat, with declines in confidence and risks around the extension of federal income support.
While the risks are real, there is also the likelihood that continued medical improvement will support confidence and spending growth again and that federal support will be renewed. Therefore, the most likely case appears to be continued improvement on both the medical and economic fronts.


