

 Print
Print Last week, we started thinking about what the long run really means for investors. It was a decent first cut, but the graphs I used to illustrate my point were not as useful as I had hoped. Today we’ll take a more numerical look at the argument.
Several years ago, I wrote a paper that addressed a similar set of problems. It looked at returns over each decade from the 1970s through the 1990s, using both minimum and average returns, summarized as follows. (Note that this includes all 10-year periods, on a monthly basis, ending in the target decade.)
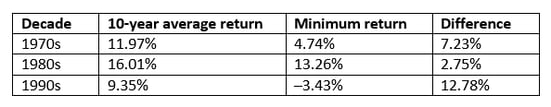
As you can see, the returns varied dramatically by decade. Trying to estimate the next 10 years using the past 10 would have been very misleading. In the 1980s, you did very well no matter what. In the 1990s, you could actually lose money over a 10-year period if you were unlucky in your starting and ending points.
There were similar results for different holding periods, which suggests that the analysis in the last post is not the best way to look at the issue. In fact, it illustrates a question that strikes at the core of the problem: Why should we assume that returns over past time frames are valuable indicators of returns in the future? That assumption was baked into both the prior post and the charts above, but does it make any sense?
After all, as the standard investing disclaimer states, past performance is not indicative of future results, and we have seen this proven over and over. Think of the economy and the financial markets as growing, complex, adaptive systems—in a way, much like people. And just like a person, they can be in a good mood, get sick, throw tantrums, and so forth. Would you judge someone’s next 10 years based on the past decade? For most of an individual’s life, that would make very little sense.
If time isn't a good indicator, what is?
One possibility lies in the idea of mean reversion—in other words, that changes over various time periods tend to bounce around a central tendency. (We saw this in the charts in the last post.) Of course, this brings time back into the equation, insofar as shorter time periods tend to show more of a central tendency, as you can see on the graph.
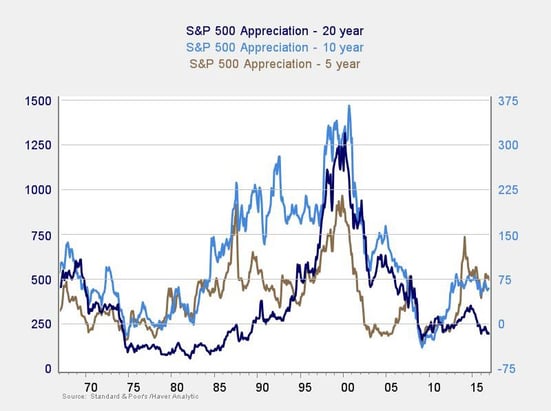
The five-year line tends to bounce around a central number, returning to it whenever it gets too far afield. But this doesn’t actually tell us much about what the next period will look like. The other problem is that we haven’t identified the underlying factor that drives this mean reversion.
The search continues . . . .
Our challenge is to find some fundamental factor that explains future returns over a given time period. If we can identify a factor that is both empirically and theoretically consistent with those future returns, this could be a much better guide to the long run than trying to do a time-based analysis, which has no theoretical justification and, as we saw in the previous post, not all that much empirical success.
We’ll take a look at what kind of indicator that might be in the next post. Before we go there, though, it's interesting to note that we started looking at returns over time but have now moved on to something very different. Clearly, what investors need to be looking at is not always what we think we should be looking at.


