

 Print
Print As I wrote earlier this week, for investors, the difference between the short term and the long term is not as obvious as it would seem. Where does one end and the other begin?
Short-term noise vs. long-term signals
The first step in answering that question, I think, is to decide exactly what we’re trying to accomplish. For investors, the main challenge is distinguishing between short-term noise and long-term signals. When we look at historical data, we need to identify the most predictive period over our time horizon.
Clearly, one good or bad month, quarter, or year is not predictive. Short-term results have obvious problems, as they can be swayed by onetime and random events. Longer-term results may have different problems but, in the end, produce similar effects. Trends that play out over a decade or more could, in theory, give rise to exactly the kind of high variance in results that makes short-term trends bad indicators of the future.The question is, at what point are the short-term and long-term uncertainties roughly balanced?
Identifying the most predictive time period
To help answer that question, we'll review two long-term data sets. For both the national economy (GDP) and stock prices (the S&P 500 Index), we’ll go back 50 years, looking at total growth over periods of 5 years, 10 years, and 20 years. The idea is to examine the variance of each time period over the entire 50-year data set, to get an idea of what we as investors should consider the long term. Note that, in each case, the long term doesn't refer to the duration of an individual’s investment process, but the time period over which we can reasonably both evaluate the past and project the future.
Looking first at the economy as a whole, for all time periods, growth reached a peak in the early 1980s and has since fallen off significantly—a drop that continues. For our purposes, though, we can see that changes in the various time periods’ growth levels have been significantly higher for the longer ones.
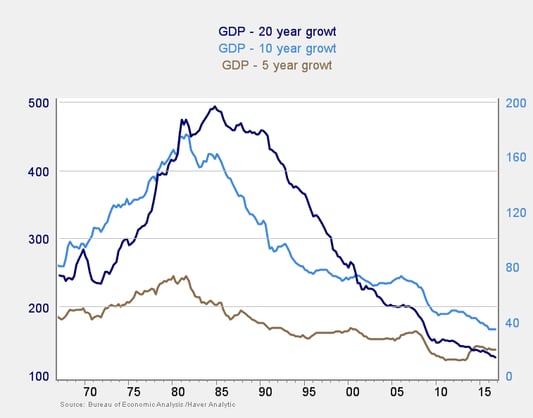
In the past decade, for example, both the 10- and 20-year numbers have dropped much more than the 5-year number. In fact, the 5-year number has been reasonably consistent, despite the recent drop and recovery, since around 1995.
Looking at this chart, the variance in the 20-year data, significantly influenced by long-term trends, is much larger than I like to see in any forecasting metric I use. Though more consistent, the 10-year data is also less reliable than I would like. Given its relative consistency, the 5-year data appears to balance as much as possible the short-term variance against the long-term trend changes.
One data set, of course, does not solve the problem, so let’s look at another one: stock market appreciation. Here, interestingly, we see somewhat different results. Although the economic numbers have been converging in recent years, the stock market numbers have diverged.
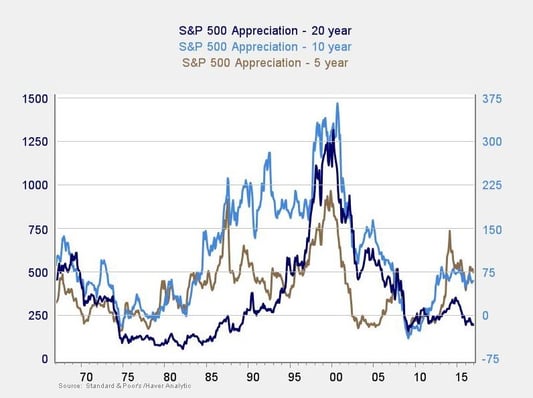
Looking at the individual time frames, however, both the 5- and 10-year numbers rotate more consistently around a central tendency than the 20-year numbers. In this case as well, the longest signal appears less predictive. Based on this analysis, the long term can reasonably be cast as between 5 and 10 years (for analytical purposes), which is perhaps much shorter than most people would think.
This post is by no means the last word on the subject. I can see several problems, both conceptual and methodological, in the analysis we've done here. At the same time, the fact that both data sets offer similar results, which are consistent with the underlying context, suggests there's probably some validity to it. I'll continue to think about this and post more as I go.


