 Recently, I have been getting a number of questions about inflation. Is it coming? How bad will it be? And, of course, what should I do about it? It has been interesting, because inflation has been largely off the radar for some years—it simply has not been a problem. What has been driving the concern now seems to be worries about the effects of the federal stimulus programs, which many think will drive more inflation. But I don’t think so. To show why, let’s go back to history.
Consumer Price Index
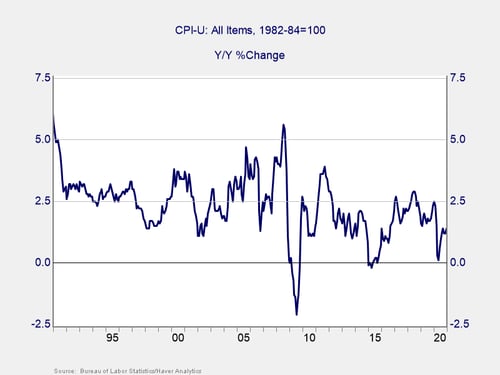
All items. Let’s start with the full Consumer Price Index, including all items. Over the past 20 years, inflation has averaged around 2.5 percent, on a year-on-year basis. Before the great financial crisis, inflation ranged around 2 percent to 3 percent; there was a spike to over 5 percent, coming out of the crisis. Since then, for the past decade, the average has been around 1 percent to 1.5 percent, and the highest level has been around 2.5 percent. Note the highest level of the past decade was the average of the previous decade. Inflation has been trending down.

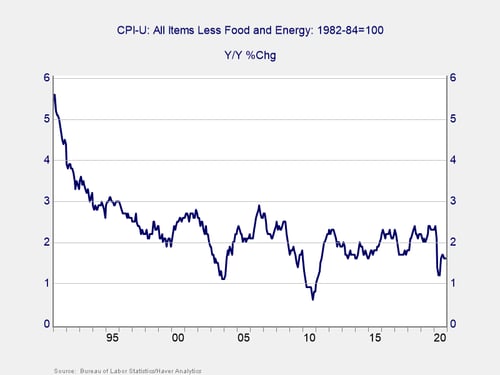
Less food and energy. A better indicator of general price inflation, however, is core inflation, which takes out two highly variable items: food and energy. Here, we can see inflation is lower and more consistent: around 2 percent for the past two decades, and ranging between 2 percent and 3 percent. Right now, we are at about 1.5 percent, not too far off from the average.

This history is the context for what we will likely see over the next year or so. The 20-year period above includes multiple episodes of contraction and recovery, including multiple episodes of monetary stimulus and fiscal stimulus. Yet inflation remained remarkably stable. When we look ahead, we have to consider what is likely to happen and compare it with what has already happened.
The Federal Deficit
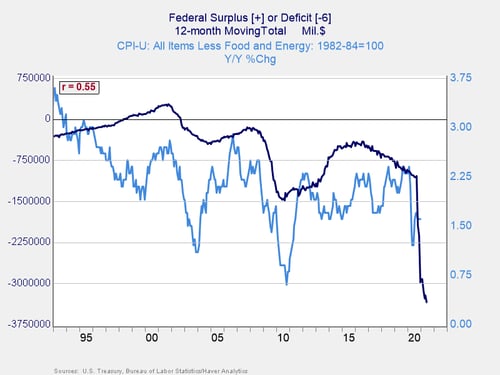
To my mind, the most immediate comparison to the current stimulus package is the federal deficit over the past 20 years. Deficit spending, in general, is the government spending money it does not have. To the extent this pushes up demand, without pushing up available supply, it should create inflation. The stimulus, after all, is just more deficit spending. So, if deficit spending and inflation are positively correlated, then the stimulus will likely push inflation up.

That scenario is not what we see, however. The correlation is positive, as shown in the chart above. But because of the way the chart is constructed, that means as the deficit gets bigger, the inflation rate actually drops. In other words, a larger deficit, over the past 20 years, has meant a lower inflation rate. As the stimulus package increases the deficit, per this relationship, it should drive inflation lower—not higher.
I don’t actually believe that, mind you, as correlation is famously not causation. What I do take away from it is that history does not tell us that the stimulus will necessarily cause inflation. Inflation is not inevitable here. So, what does it tell us?
Inflation Depends on Demand
History tells us that inflation depends more on demand and that when demand collapses in a crisis, so does inflation, even with the higher deficit spending. Post-2000, we saw the deficit increase and inflation drop, only to see the trend reverse as the economy recovered. In 2008–2009, we saw the same thing, as the deficit spiked and inflation dropped, only to recover when the economy normalized. This time, we have seen the first half, with the deficit rising and the Consumer Price Index dropping, and we will see the second half shortly as the economy recovers. Inflation will go up again.
Look at the Trends
But the final thing history shows us is that as inflation recovers, it does not run past earlier typical levels for very long. Post-2000, inflation rose briefly to relatively high levels, then subsided again. Post-2008, the same thing. We can expect the same in 2021 and 2022, starting in the next couple of months. As year-on-year inflation comparisons look back to the initial economic drop of the pandemic, they will spike. But as the year-ago comparisons get more healthy, the changes will drop back again—just as we saw in the last two crises.
At that point, as the economy normalizes and as people and businesses go back to normal behavior (“normal” defined as more or less what we have done for the past decade), inflation will then trend back to that same normal level, in this case about 2 percent. Yes, this is above where we are now, but where we are now still reflects the pandemic. A recovery to normal would be just that, normal.
So, Will Inflation Go Up?
Yes, it will. Will it threaten the economy or markets? No, because higher inflation will simply reflect a move back to the normal of the past decade. And that is something we should all be hoping for.


 Print
Print

