

 Print
Print One of the most surprising things to come out of the first half of 2022 was the walloping fixed income investors received from bonds. The Bloomberg U.S. Aggregate Bond Index posted its worst 12-month return in its entire history, which caused many investors to shed exposures, particularly longer-term sectors.
Now that the dust has settled a bit, talking to investors about reconsidering the space is very much an uphill battle. I get it. Inflation continues to rise, further rate hikes are on the horizon, and recent returns are the worst in decades. That doesn’t present a very attractive scenario for a fixed income investor. But let’s have a look at where things are likely to go as opposed to where they’ve been.
Inflation and Rates
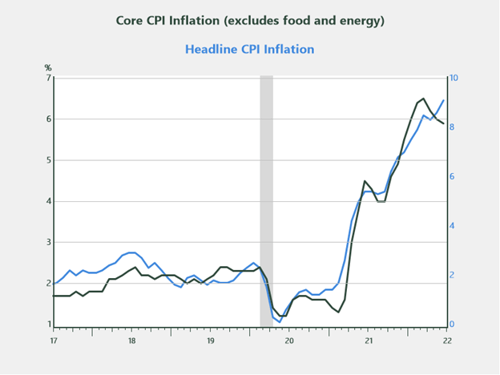
It’s hard to have a conversation about fixed income without talking about inflation, so let’s start there. As I mentioned in a previous post, there’s strong evidence to suggest that inflation has peaked. Aside from food and energy, the core components of inflation appear to be rolling over, as shown in the chart below. Many of the areas that led inflation higher throughout the pandemic (e.g., used cars and trucks, home furnishing, and housing) are now starting to see price moderation as inventories build and demand slows.
Source: Haver Analytics
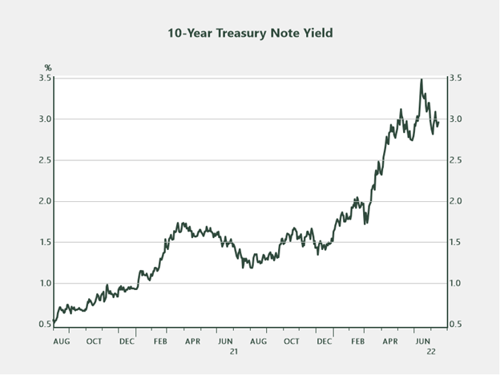
Core inflation represents about 80 percent of headline CPI. If current trends continue, which they should, the core component of CPI will have a dampening effect on the overall inflation picture as we move into the fall months. This notion is currently being reflected in markets, as evidenced by recent trends in the 10-year Treasury yield.
Source: Haver Analytics
The second quarter of 2022 saw the largest year-over-year inflation numbers in 40 years, yet the 10-year Treasury yield is trading around the same level it was when the quarter started. This fact suggests that investors believe inflation is transitory as opposed to structural and that the economy may be inching toward a slowdown—a scenario that’s being reflected in the shape of the yield curve as of late.
Yield Curve
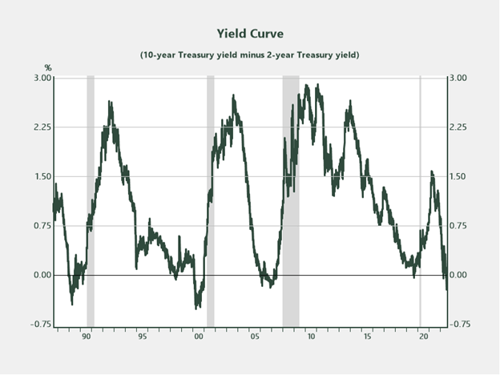
The yield curve reflects investor sentiment as it relates to short- and long-term projections of the economy and rates. Currently, investors are selling U.S. short-term Treasuries in anticipation of further rate hikes from the Fed. Short-term yields are moving higher, while longer-term rates are repricing lower in anticipation of moderating inflation and an economic contraction. The result is what’s called a curve inversion, a scenario that has pre-dated every recession (the gray areas in chart) over the past 40 years by roughly 12–18 months. If this historical relationship holds, it would set up a recessionary scenario at some point in mid-to-late 2023.
Source: Haver Analytics
Fixed Income Outlook
Higher-quality, longer-maturity sectors. Considering the possibility of an economic slowdown on the horizon (combined with moderating inflation), the prospects for high-quality fixed income look good, particularly longer-maturity investment-grade segments. When the economy slows and the Fed is forced to react by lowering short-term rates, investors generally seek out higher-yielding, longer-maturity areas. Prices in those sectors tend to rise as demand outpaces supply.
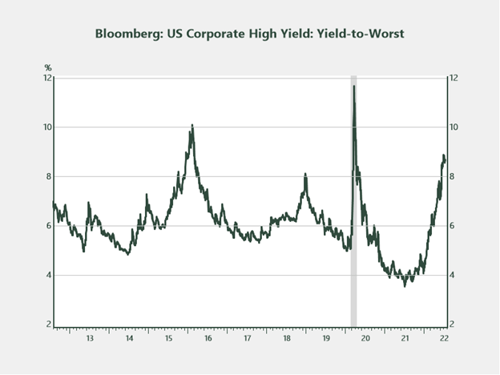
Lower-quality segments. One area that succumbed to a considerable amount of selling pressure in the first half of 2022 is the high-yield space. Currently, the yield-to-worst on the Bloomberg U.S. Corporate High Yield Index is 8.7 percent, a level that’s only been reached three times in the past decade. The price of bonds in the index is averaging $87 (par of $100), which isn’t too far off from where things ended up in the 2020 downturn. As investors consider their fixed income outlook and allocations, this is one area that deserves some attention.
Source: Haver Analytics
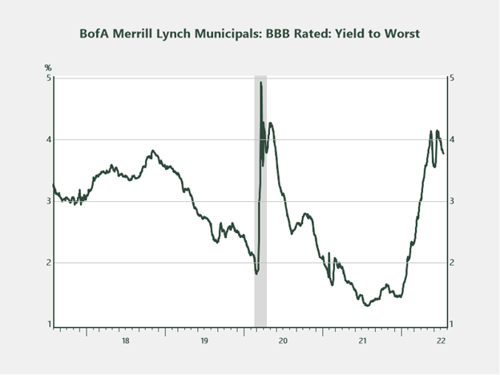
Municipal bonds. Similar to other fixed income sectors, municipal bonds came under a lot of pressure in the first half of the year. The yield-to-worst on the BBB-rated BofA Merrill Lynch Municipal Index currently stands at 3.8 percent, which equates to a 5.4 percent taxable-equivalent yield for someone in the 30 percent tax bracket. In the lower-credit-quality, high-yield municipal space, yields look even more attractive, with the Bloomberg Municipal Custom High Yield Composite Index yielding 4.2 percent (taxable equivalent of 6 percent).
Source: Haver Analytics
The Road Ahead
Over the next few quarters as the Fed continues with its aggressive approach to curb inflation and markets digest every economic release with fervor, there’s no doubt fixed income will experience bouts of heightened volatility, as will equities. It’s through those periods of perceived chaos, however, that strategic long-term investors should take advantage of areas that have been unduly sold. Periods when irrationality and emotion dominate markets often present the best buying opportunities, and it now feels like one of those periods in fixed income.
Municipal bonds are federally tax-free but may be subject to state and local taxes, and interest income may be subject to federal alternative minimum tax (AMT). Bonds are subject to availability and market conditions; some have call features that may affect income. Bond prices and yields are inversely related: when the price goes up, the yield goes down, and vice versa. Market risk is a consideration if sold or redeemed prior to maturity.
High-yield/junk bonds invest substantially in lower-rated bonds and are issued by companies without long track records of sales and earnings or by those with questionable credit strength. Adverse changes in the economy or poor performance by the issuers of these bonds may affect the ability to pay principal and interest. High-yield bonds involve substantial risks, tend to be more volatile, and may not be suitable for all investors.


