

 Print
Print We’ve received numerous questions about our inflation outlook over the past few weeks. In some cases, it seems investors are beginning to throw in the towel on traditional asset classes in favor of more inflation-sensitive areas like commodities, real assets, and managed futures, which have had a good run as of late. Before making wholesale changes to portfolios, though, it’s important to understand where inflation may be headed, as opposed to where it’s been.
Headlines are telling us that the Fed let things get out of control, with inflation at its highest level in 40 years and stagflation right around the corner. I would argue that the consensus on inflation could be wrong, mostly because the numbers are suggesting that things have already peaked and will probably moderate as the year progresses. So, let’s have a look at the data and cut through the headlines.
The Bullwhip Effect and Inventory Buildup
For the past few years, the root cause of inflation has been large imbalances in supply and demand across most goods and services sectors, particularly in discretionary spending areas. When the aggregate demand in an economy strongly outweighs the aggregate supply, prices go up. This is the most common cause of inflation.
Supply chain woes and consumer demand. During the pandemic, supply was greatly constrained as shutdowns damaged global supply chains. Demand, on the other hand, increased as consumer appetites grew. That dynamic is now changing quickly, as a buildup of inventory is beginning to outpace demand. The reason is best explained by the bullwhip effect, a phenomenon that describes how businesses must forecast demand to properly position inventory and other resources. Because customer demand is rarely perfectly stable and forecasts are based on statistics, there’s often a mismatch between inventories and demand, particularly as you move up the supply chain. Let’s use a simple example to illustrate this point.
Consider someone who is a buyer for Costco in the home furnishing department, which includes furniture and electronics. Heading into 2022, they assessed demand from the latter half of 2021 and extrapolated things out for the coming year. Coming off one of the strongest periods of demand for home furnishings in decades, many buyers assumed that demand would remain robust for the foreseeable future (particularly with the backdrop of a strong housing market), and orders were placed accordingly.
Fast-forward to May and June, and a slightly different picture has emerged. Now that individuals are emerging from their pandemic hibernation, consumer preferences have shifted away from the home furnishing market to other areas like leisure, travel, and hospitality. The inventory for orders placed in December and January is now hitting shelves right as demand for home furnishings has started to wane.
Growing inventories. The imprecision and inaccuracy of forecasting future client demand are creating a significant buildup in inventories, specifically in general merchandise stores, as reflected in the chart below. Retail sales in this sector have plateaued for the past two months on a year-over-year basis, while inventories have increased almost 32 percent. One could assume there will be a moderation in prices in the coming months and quarters for many goods in this space, as supply greatly outpaces demand.
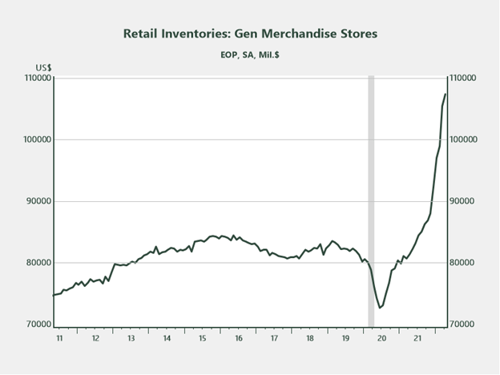
Source: Haver
The Housing Headwind on Price Inflation
Another area that’s witnessing softening sales data is the housing market. Rising mortgage rates, coupled with all-time highs in home prices, have brought affordability back to multi-decade lows, as shown below.
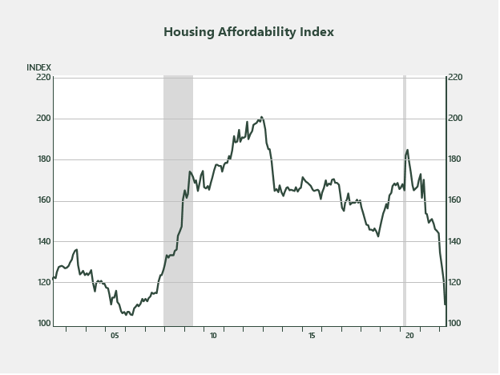
Source: Haver
The unaffordability will have ramifications for demand, which is now starting to appear in the numbers. Supply is starting to outpace demand as buyers step back from a market that was red hot heading into the year.
According to Redfin, touring activity is down, mortgage applications have dropped, and there’s been a 14 percent decrease in people googling “homes for sale” from a year earlier. The result is that the percent of active listings with price drops is rapidly increasing, as shown in the next chart.
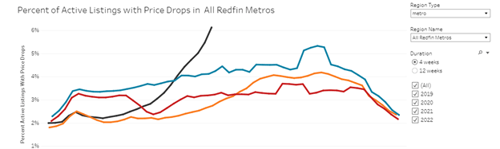
Source: Redfin
So, if housing supply continues to shift online while demand wanes, it’s reasonable to assume that home prices will moderate in the second half of the year. This could have knock-on implications for other segments of the economy like home furnishing stores, which are already suffering from a buildup in inventories.
The Future of Inflation
When considering portfolio allocation adjustments, it’s important to consider where inflation is headed in addition to where it’s been. As detailed above, there’s a real chance that inflation could moderate in the coming months and quarters as supply outpaces demand across many sectors of the economy. In that case, inflation-sensitive investments may not produce the same return profiles they did when prices rose rapidly on the backdrop of strong demand and short supply.
While an allocation to inflation-sensitive areas makes sense in a well-diversified portfolio, we would caution against wholesale changes at this time.


