 Energy was the top-performing equity sector in the S&P 500 during the first half of 2022, with a total return of 31.8 percent. Crude oil and natural gas fundamentals were favorable heading into 2022 amid strong demand, low inventories, and limited spare capacity globally. Since the pandemic recovery, demand has exceeded supply for both commodities. Furthermore, Russia’s invasion of Ukraine accelerated the supply constraints resulting in spiking energy prices.
In March, the price of West Texas Intermediate (WTI), the U.S. benchmark for crude oil, surpassed $120 per barrel for the first time since 2008. In June, U.S. natural gas prices also reached the highest level since 2008, surpassing $9 per million British thermal units (MMBtu). Energy prices began to fall in mid-June, however, following more aggressive actions by global central banks to curb inflation through faster interest rate hikes.
As such, the energy market has become more concerned about recession risk, and the focus has shifted from supply constraints to worries about weaker demand. Let’s explore if these concerns are beginning to appear in the data, as well as potential investment considerations.
Slow Recovery for Crude Oil Supply
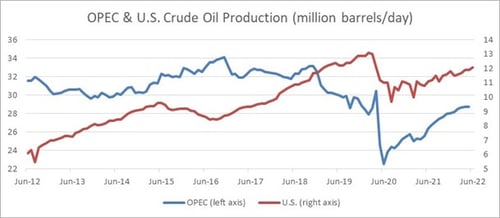
The chart below illustrates a gradual recovery in crude oil production over the past two years from OPEC and the U.S., the world’s two largest groups of producers. Current production levels remain well below the highs reached in years prior to the pandemic. (For market developments contributing to a slow recovery in global oil production, see our previous post.)
Moderate oil production growth is forecasted for the second half of 2022. The U.S. Energy Information Administration (EIA) expects U.S. production to average 12.0 million barrels per day in the second half of 2022, an increase of 200,000 barrels per day from the first half of 2022. Production growth from OPEC, however, is less certain. The group fell short of its production targets this year, and production levels have been flat in recent months due to limited spare capacity. For instance, Saudi Arabia, the group’s largest producer, recently revealed lower production capacity limits than previously expected.
Source: Bloomberg, U.S. EIA
Low Crude Oil Inventories
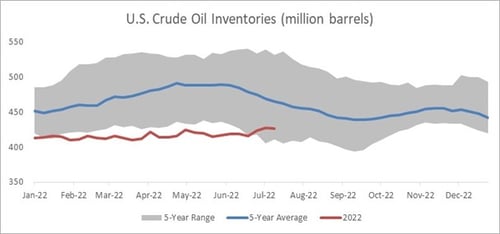
A slow recovery in crude oil production combined with strong demand has resulted in low inventories. According to the chart below, U.S. oil inventories fell below the five-year range during the first half of 2022. In July, inventories rose above the lower end of the five-year range, which is a potential sign that crude oil price pressures are easing. The price of WTI crude oil fell to around $100 per barrel in July but is still well above historical averages.
Source: Bloomberg, U.S. EIA
Gasoline Demand Destruction?
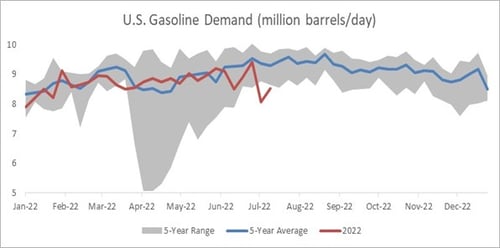
The demand for gasoline, which is the primary transportation fuel that is refined from crude oil, also appears to be easing. In July, gasoline demand dropped below the five-year range, as shown in the chart below. This drop is an indication that the spike in gasoline prices is leading to demand destruction as consumers seek to reduce consumption.
Source: Bloomberg, U.S. EIA
Volatility in Natural Gas Prices
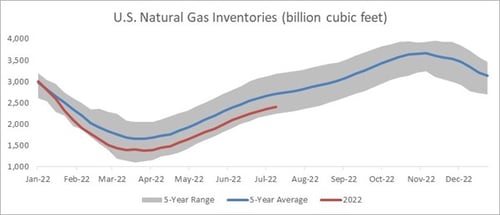
U.S. natural gas inventories are near the lower end of the five-year range as well, as demonstrated in the chart below. Natural gas demand is generally less sensitive to economic activity compared to crude oil. Because natural gas is primarily used for power generation to heat and cool buildings, demand is seasonal and highly sensitive to weather conditions. As indicated below, storage levels typically build from the spring through the fall to prepare for peak demand in the colder winter months. Natural gas prices have been extremely volatile over the past two months, ranging from around $5.40 to $9.30 per MMBtu.
Source: Bloomberg, U.S. EIA
Energy Fundamentals
Crude oil. Fundamentals remain positive but are showing signs of rising risks and the likelihood of weaker fundamentals. Entering the second half of 2022, inventories are gradually rising, and gasoline demand is falling, pointing to easing price pressures for crude oil and gasoline. Crude oil prices are likely to remain sensitive to comments from global central banks regarding inflation and the pace of interest rate hikes as investors digest the potential implications for the economy and crude oil demand.
Natural gas. Here, fundamentals also remain positive with stronger demand prospects compared to crude oil. With low inventories relative to the five-year average, price pressures could persist if a warmer-than-expected summer slows the pace of inventory builds throughout the year. In addition, natural gas demand is expected to remain strong as Europe seeks liquified natural gas exports from the U.S. to reduce its reliance on Russian energy supplies.
The Investment Impact
Although the energy sector was a strong performer in the first half of 2022, investors may want to consider a more cautious approach to the sector given its commodity price sensitivity, cyclical characteristics, and above-average risk profile historically. Large-cap companies with business models that are diversified across the oil and gas supply chain tend to be less sensitive to energy prices compared to companies focused on a specific subsector, such as exploration and production.
Investments in commodities may have greater volatility than investments in traditional securities. Specific commodities industries are affected by world events, government regulations, and economic and political risks. The value of commodity-linked derivative instruments may be affected by changes in overall market movements, commodity index volatility, changes in interest rates, or world events, such as drought, floods, weather, livestock disease, embargoes, tariffs, and international economic, political, and regulatory developments. Use of leveraged commodity-linked derivatives creates an opportunity for increased return but, at the same time, creates the possibility for greater loss.


 Print
Print

