

 Print
Print As we embark on the summer driving season, the average price of regular gasoline in the U.S. has reached an all-time high, surpassing $4.50 per gallon. Strong demand, supply chain disruptions, and low inventories have been common inflationary pressures among consumer goods, including gasoline. But what specific market factors are fueling sky-high gas prices?
Operating Costs and Taxes
Crude oil is the most important input cost for gasoline. The commodity is primarily refined into gasoline and other transportation fuels, including diesel and jet fuel. Ethanol, a fuel made from corn, is blended with crude oil to represent 10 percent of gasoline volume on average, according to the Energy Information Administration (EIA). The operating costs associated with refineries, transportation (e.g., pipelines, tankers, trucking), and gas stations, as well as federal, state, and local government taxes, all contribute to the price of gasoline. Differences in operating costs and taxes explain the wide range of gas prices across states.
The Correlation to Crude Oil
The chart below illustrates the strong correlation between the prices for gasoline and crude oil, which is currently around $115 per barrel for West Texas Intermediate (WTI), the U.S. index. Prices for both commodities have about doubled since early 2021. Covid-19 lockdowns in China and plans by several countries to release strategic oil reserves have helped ease oil prices in recent months. The price of gasoline, however, has continued to spike further.
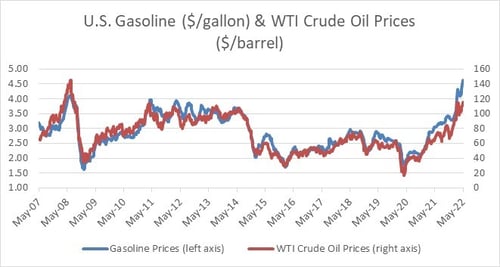
Source: Bloomberg
Refinery Capacity
Demand for transportation fuels, such as gasoline, dropped sharply early in the pandemic when consumers stayed home, causing several refineries to close permanently. Global refinery capacity fell in 2021 for the first time in 30 years, according to the International Energy Agency. U.S. refinery capacity dropped to 2015 levels, as shown below. In addition, existing U.S. refineries have limited spare capacity with utilization rates above 93 percent, the highest since December 2019. Meanwhile, refiners are generating record profits from strong demand, capacity constraints, and a higher spread between prices for oil and refined products, such as gasoline.
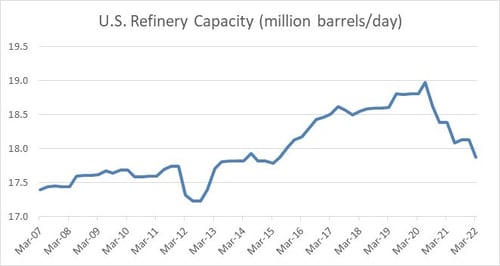
Source: Bloomberg
Supply Vs. Demand
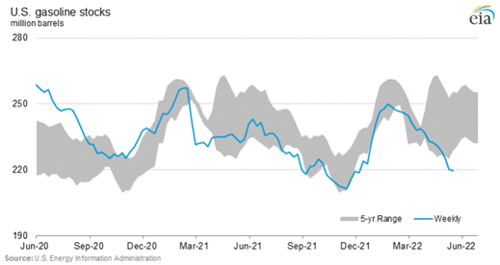
Both U.S. gasoline and oil inventories are at low seasonal levels compared to the five-year range. The chart below demonstrates U.S. gasoline inventories. Gasoline and oil demand recovered faster than supply over the past two years as the economy recovered from the pandemic. Refineries typically boost output before demand peaks during the summer driving season; however, capacity constraints limited supply increases. Although the U.S. still imports oil because its refineries were initially designed to process heavy crude produced from other countries, such as Canada and Venezuela, higher U.S. exports have reduced inventories as Europe seeks to reduce its reliance on Russia for energy imports.
Global oil producers quickly cut capital expenditures early in the pandemic to preserve cash for debt servicing and other operating expenses amid highly uncertain oil demand and plummeting prices that fell to around $20 per barrel. The chart below illustrates the decline in oil production from OPEC and the U.S., the world’s two largest groups of producers. Supply from Russia, the world’s third-largest oil-producing country behind Saudi Arabia, also declined after its invasion of Ukraine.
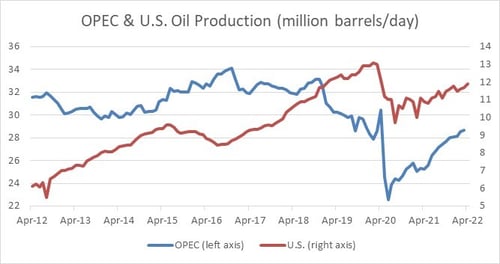
Source: Bloomberg
Slow Recovery for Oil Production
Global oil production is slowly recovering as producers have been more cautious investing in long-term projects, such as offshore drilling, due to a highly uncertain demand outlook for oil. For instance, traditional automakers are investing heavily in electric vehicles amid policy support and plans by several countries to phase out internal combustion engines (e.g., gasoline, diesel) in the coming decades.
Furthermore, shareholders have forced publicly traded oil and gas producers to focus on capital discipline, profitability, reducing debt, and investor returns through dividends and stock buybacks. Production growth was the prior objective from a capital allocation standpoint; however, producers struggled overall to generate positive cash flow and earnings following the 2014–2016 crash in oil prices.
Several other market developments have contributed to a slow recovery in oil production:
- U.S. oil producers focused on drilled but uncompleted wells to limit costs when oil demand began to recover after the pandemic. In other words, producers sacrificed future supply growth by completing existing wells at a faster rate than drilling new wells.
- A large portion of U.S. oil supply is produced from shale regions, such as the Permian Basin. Compared to conventional wells, shale wells have high depletion rates that average around 70 percent by the end of the first year, according to asset manager GMO. This requires continuous capital expenditures to maintain or increase production levels by drilling new wells.
- Small private oil producers have been the main source of production growth in the U.S. as opposed to larger publicly traded producers given shareholder demands for capital discipline.
- Inflationary pressures and shortages for labor and materials, such as steel, reduced the operating capacity for oil field service companies, which supply oil rigs and other equipment to producers.
The U.S. is the world’s top oil-producing country, with supply averaging 11.9 million barrels per day over the past two months. Forecasts from the U.S. EIA imply moderately higher production of about 200,000 barrels per day for the remainder of 2022. Oil production growth is expected to accelerate in 2023 and reach an all-time high, averaging more than 12.8 million barrels per day.
Relief in Sight?
Gasoline and oil prices could ease or decline later in the year with the potential for higher supply growth and weaker demand. But gasoline and oil prices are likely to remain elevated this summer given global supply constraints, low inventories, and pent-up travel demand. Further, supply disruptions could persist through summer. Forecasts from the National Oceanic and Atmospheric Administration are calling for above-average hurricane activity this season, and a significant portion of U.S. energy infrastructure, including oil wells, pipelines, and refineries, is located near the Gulf of Mexico.


