

 Print
PrintVolatility in financial markets
November was a month of politics, not only in the U.S., but throughout the world, and market action reflected this. In the U.S., just as the government ended up looking pretty much the same at the end of the month as it had at the beginning, equity markets ended November not far from where they began. The S&P 500 Index returned 0.58 percent.
This small change masked quite a bit of volatility, including a significant post-election sell-off and a sharp rebound later. On November 7, the morning after the U.S. presidential election, markets tumbled more than 2 percent. Investors shifted their attention from who would win the election to the fact that the government had not changed much and that it now had to deal with an upcoming fiscal cliff.
In addition to the political reaction, technical factors came into play. The post-election tumble took the S&P 500 below its 200-day moving average, and momentum carried stocks downward, for a total loss of more than 5 percent. Thereafter, we saw a gradual rebound in investor confidence, probably attributable to recovering hopes that the country would not go off the fiscal cliff, as well as to reasonably robust U.S. economic data. At month-end, U.S. indices had moved back above their 200-day moving averages and seemed to have once again stabilized.
International equities broadly outperformed U.S. stocks in November, with returns of 2.42 percent for the MSCI EAFE and 1.18 percent for the MSCI Emerging Markets indices, respectively, but showed similar volatility. On the U.S. Election Day, for example, the European Commission released a report that anticipated a 0.3-percent contraction in European Union gross domestic product (GDP) for 2012 and GDP growth of only 0.4 percent over the entire 2013. Although this shouldn’t have come as much of a surprise, international markets reacted badly, declining in unison with U.S. markets.
Since then, both developed and emerging equities have recovered, as a result of an improving political situation in Europe. Particular outperformance came from the troubled European nations—Greece, Portugal, and Italy—as investors reacted to Germany’s more conciliatory approach to Greece’s debt situation and the conclusion of a third Greek debt deal.
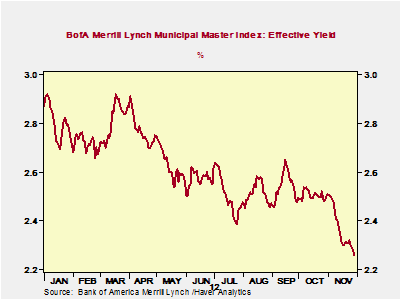
Despite the recovery in the equity markets, demand for U.S. Treasuries remained high. The 10-year Treasury yields fell from 1.69 percent to 1.6 percent, the lower end of a trading range that was established back in August. High-yield spreads tightened slightly as well. The Barclays Capital Aggregate Bond Index returned 0.16 percent, while the Barclays Capital U.S. Corporate High Yield Index returned 0.8 percent. But by far the most notable development in the fixed income realm was a sharp drop in municipal bond yields, from 2.5 percent to 2.25 percent by month-end (see chart). Driven by a general expectation of higher tax rates, the decline left municipal valuations at the high end of the post-financial crisis range.
Political volatility continues to drive market volatility
At the end of November, expectations in the U.S. were generally positive but remained subject to change daily, as the rhetoric out of Washington shifted from optimistic to defeatist regarding the so-called fiscal cliff. It seemed at this point that Republicans were more open to the prospect of raising revenue, but it remained unclear whether a compromise over raising taxes on the one hand and cutting spending on social programs on the other could be reached. Given the nature of the negotiations, where early compromise could be seen as weakness, the story can be expected to go to the end of the year.
Similarly, Europe has had no early resolution in sight to its fiscal problems, just a series of half-measures. Although a temporary solution was put in place for Greece, other countries—notably Italy and France—still have significant, unresolved problems. This continuing uncertainty could create ongoing market volatility.
Beyond the developed world, other areas of concern include the Middle East, where violence has escalated between Israel and Hamas and Egyptian President Morsi has granted himself broad powers. So far, this has not translated into a significant change in oil prices, but investors are watching the region closely. The China Seas continue to worry analysts as well, with China and Japan continuing to face off over the Senkaku/Diaoyu Islands. Again, geopolitical uncertainty could add to market volatility going forward.
U.S. economy doing well, despite uncertainty
Probably the best news out there is the performance of the U.S. economy. Growth has just been revised up to 2.7 percent for the third quarter of 2012, which has largely been attributed to the housing recovery and strong consumer spending.
Housing continues to perform strongly, with house prices up for eight months in a row, per the Case-Shiller indices, by an average of 3 percent over the past year. Even the worst-hit cities, such as Las Vegas, Phoenix, and Detroit, have shown price gains, and home sales nationwide were up 17 percent year-over-year in October. Inventories of homes available for sale have declined below historical average levels in many markets, suggesting that price increases may continue. Higher home values have a number of positive effects, including increased consumer confidence, the wealth effect, improved labor mobility, and others, all of which contribute to stronger economic growth.
Consumer spending has also remained reasonably strong, buoyed by consumer confidence, which increased to a near five-year high in November. Despite a dip in October, possibly caused by Hurricane Sandy, it appears as if this strength will continue. In addition, sales over the Black Friday weekend were up materially compared with last year. One area of consumer spending that has particularly improved is auto sales, where pent-up demand drove sales in October to another four-year high. Both housing and auto sales are foundational components of any recovery, and their combined strength provide support for continued growth.
If strong housing and consumer spending numbers are expected to continue, what’s the problem? The answer, of course, is the fiscal cliff, which is deterring business hiring and investment. There is a gap in perception between consumers, who are spending as if the cliff did not exist, and businesses, which have essentially stopped hiring and investing unless absolutely necessary. Even with these worries, however, according to the Federal Reserve, employment improved in more than half of the Fed’s 12 regions in the third quarter, and growth improved in 9. Should the cliff be resolved successfully, a pickup in business investment and hiring could spur additional growth.
Looking good, but politics remain a risk
Overall, the U.S. economy looks to be performing strongly, but risks remain. The third quarter of 2012 was probably stronger than the fourth quarter will be, and 2013 remains subject to spending cuts and tax increases that could materially reduce growth levels. Even if an agreement is reached to avert the cliff, changes such as the expiration of extended unemployment benefits and the 2-percent payroll tax waiver will negatively affect the economy.
Nonetheless, the economic fundamentals look good, and the expectation now is for continued recovery, despite outstanding risks, such as governmental inaction in the U.S. and Europe or military action in Asia and the Middle East. We will be watching Washington, DC closely as the year comes to a close, but we remain cautiously optimistic that the U.S. will remain on its current positive trajectory.
Disclosure: Certain sections of this commentary contain forward-looking statements that are based on our reasonable expectations, estimates, projections, and assumptions. Forward-looking statements are not guarantees of future performance and involve certain risks and uncertainties, which are difficult to predict. Past performance is not indicative of future results. Diversification does not assure a profit or protect against loss in declining markets. All indices are unmanaged and investors cannot invest directly into an index. The S&P 500 Index is a broad-based measurement of changes in stock market conditions based on the average performance of 500 widely held common stocks. The MSCI EAFE Index is a float-adjusted market capitalization index designed to measure developed market equity performance, excluding the U.S. and Canada. The MSCI Emerging Markets Index is a market capitalization-weighted index composed of companies representative of the market structure of 26 emerging market countries in Europe, Latin America, and the Pacific Basin. It excludes closed markets and those shares in otherwise free markets that are not purchasable by foreigners. The Barclays Capital Aggregate Bond Index is an unmanaged market value-weighted index representing securities that are SEC-registered, taxable, and dollar-denominated. It covers the U.S. investment-grade fixed-rate bond market, with index components for a combination of the Barclays Capital government and corporate securities, mortgage-backed pass-through securities, and asset-backed securities. The Barclays Capital U.S. Corporate High Yield Index covers the USD-denominated, non-investment-grade, fixed-rate, taxable corporate bond market. Securities are classified as high-yield if the middle rating of Moody’s, Fitch, and S&P is Ba1/BB+/BB+ or below.


