

 Print
PrintAfter significant bouncebacks in the major indicators over the past couple of months, we saw a bit of a pullback in several components of the data in October. With signs of slowing job growth and a drop in consumer confidence, the positive changes in trend we hoped for last month may have been put on hold. One caveat for this month’s data, though: the weakness may have more to do with the turmoil around the U.S. election than with the economy itself.
We will see. There are no signs of immediate concern just yet, but both the current weakness and recent volatility suggest we need to remain cautious in our expectations. The signal for the economy remains a green light, but the warning flags continue to fly.
The Service Sector
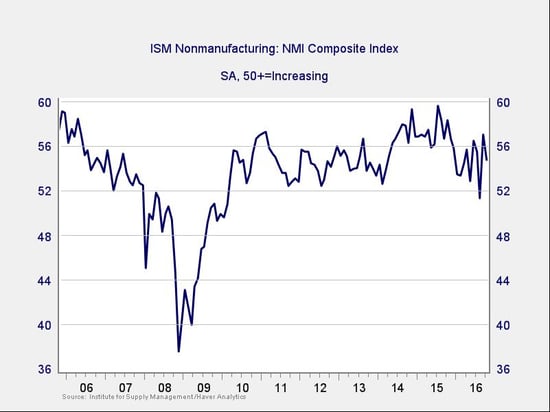
Signal: Green light
After a sharp increase two months ago, service sector sentiment dropped back a bit last month. Still, it remains at a healthy level, well into expansionary territory, and the recent uptrend remains intact, suggesting the recent drop may be more noise rather than a change in trend. Though the index remains in expansionary territory, the volatility we’ve seen this year continues to raise a question as to whether the expansion may be rolling over. As of right now, however, the data suggests that the improvement continues.
Continued strength in the service sector is consistent with business confidence; as a representative sample of the largest sector of business, this is an important leading indicator.
Private Employment: Annual Change
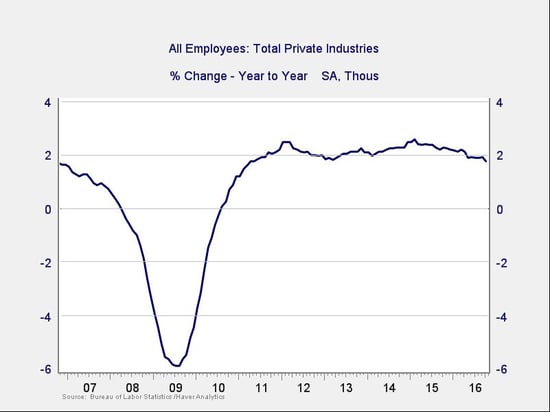
Signal: Green light
This month’s job creation number came in below expectations, but the details painted a better picture. Job growth was consistent with the previous month, and even though longer-term growth trends are slowing, that is to be expected in this stage of the cycle. The big news was that wage growth moved to a seven-year high, suggesting that the labor market continues to tighten and validating the ongoing strength of job growth. The annual trend is slowing, based on the most recent month’s data, but it remains at levels consistent with stable growth and with those of the mid-2000s.
Because this is an annual figure, the changes are slower and smaller than those we see in more frequently reported data. Overall, given the volatility of employment growth, this indicator remains a green light.
Private Employment: Monthly Change
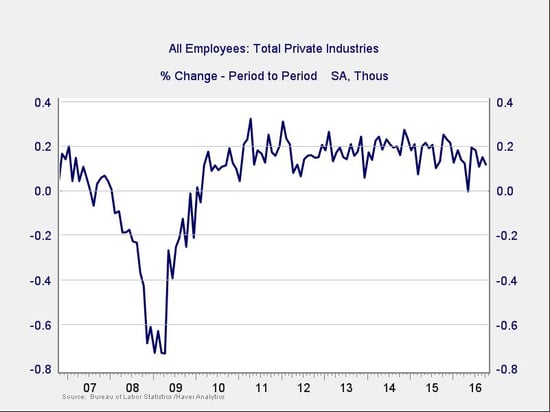
Signal: Green light, but needs to be watched
These are the same numbers as in the previous chart, but on a month-to-month basis, which can provide a better short-term signal. October’s job creation was somewhat below expectations, but the details were more promising than the headline number would suggest.
Overall, job creation falls within the range of the past couple of years. We’ll keep this at a green light for the moment, but I will be watching it to confirm that the positive trend continues.
Yield Curve (10-Year Minus 3-Month Treasury Rates)
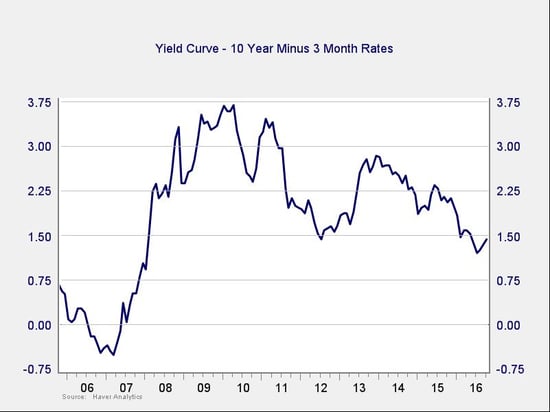
Signal: Green light
With Federal Reserve members continuing to state that the U.S. economy is in reasonable condition, and the most recent Fed minutes hinting at a rate hike by the end of the year, rates for the 10-year Treasury rose over the past month. The net effect was that the spread between short- and long-term rates rose further.
Though the spread remains at a low level, this indicator is outside the risk zone, and the possible change in trend is encouraging. The negative risk here is also much smaller than with the other indicators, and this metric remains in healthy territory.
Consumer Confidence: Annual Change
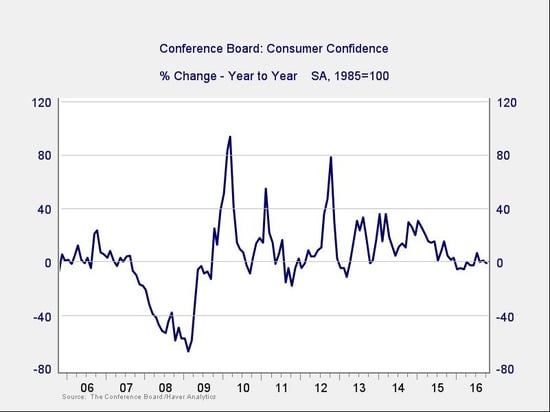
Signal: Yellow light
Consumer confidence dropped back last month after increasing substantially the previous month, and the year-on-year growth rate has ticked down over the past couple of months. Though still well away from the trouble zone, the indicator no longer appears to be improving.
That said, the base confidence level remains healthy, and with consumers continuing to grow both earnings and spending, there seems to be little immediate risk. The downward trend does appear to have resumed over the past couple of months, and because of that, we’ll leave this signal at a yellow light until we see convincing evidence of a shift to a positive trend.
Conclusion: Economy healthy, but keep an eye on negative trends
Business confidence has become very volatile, so this month’s pullback is not all that discouraging, as the metric remains expansionary and the trend positive. Although consumers continue to remain confident on an absolute basis, the recent slowdown in employment growth and concerns about the future suggest that area might be vulnerable as well. Overall, conditions remain positive, but there are several signs that trends may be changing.
The risk remains elevated, although not immediate, and we certainly need to watch how the economy evolves. Given the generally healthy levels of the data, however, and the real possibility that last month’s weaker performance may be at least partially due to concerns about the election, the overall indicator will stay at a green light.


