

 Print
PrintAfter the bad news last month, several major economic indicators have bounced back significantly. The service sector was the biggest positive surprise, but manufacturing also moved back into expansion territory, and consumer confidence jumped up in a big way. Although job growth was somewhat below expectations, it remained at a healthy level.
Thanks to these bouncebacks, there are no signs of immediate concern, but the recent volatility in the data suggests we need to be cautious in our expectations. Although the signal for the economy remains at a green light (and looks brighter than last month), the warning flags continue to fly.
The Service Sector
Signal: Green light
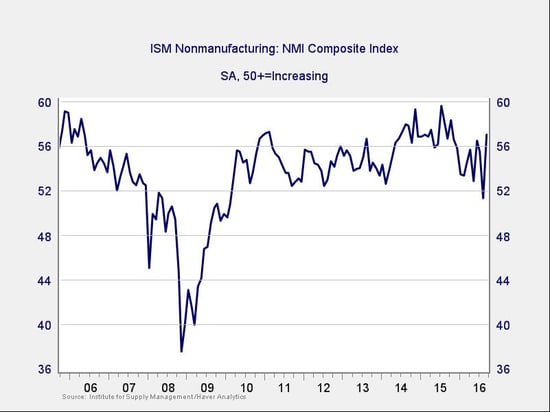
After a sharp drop, service sector sentiment rallied back to its highest level this year. Though this upward move is welcome, the prior month’s drop to a six-year low suggests that volatility may well continue. The ISM Non-Manufacturing Index remains in expansionary territory, but the turbulence we’ve seen this year raises concerns that the expansion may be rolling over.
In the short term, the size of the bounce is positive, but we will need a couple more good months to regain full confidence. At the moment, business and employment expansion look uncertain, and we may have to revise our expectations down. Continued strength in the service sector is consistent with business confidence; as a representative sample of the largest sector of business, this is an important leading indicator.
Private Employment: Annual Change
Signal: Green light
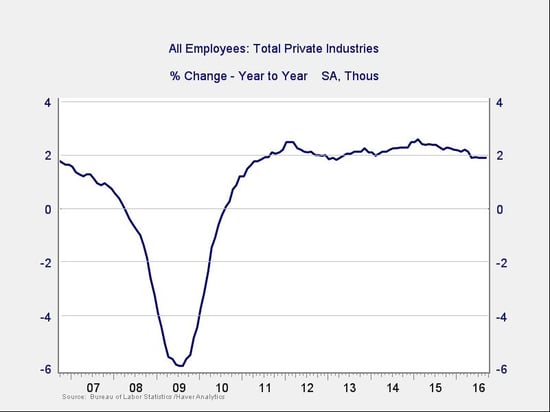
September job creation came in below expectations, but the details painted a better picture. Job growth was consistent with the previous month, and private employment actually grew faster. More important, the average workweek and wage growth both bounced back, relieving a worry from the previous month.
With the past month's data, the annual trend remains stable, at levels consistent with steady growth, like those of the mid-2000s. Because this is an annual figure, the changes are slower and smaller than those we see in more frequently reported data. Overall, given the volatility of employment growth, this indicator remains a green light.
Private Employment: Monthly Change
Signal: Green light, but needs to be watched
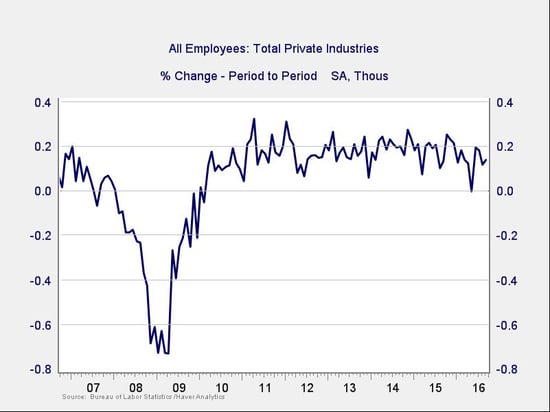
These are the same numbers as in the previous chart, but on a month-to-month basis, which can provide a better short-term signal. September’s job creation was disappointing compared with expectations, but stronger details marked an improvement over August, and the data remained within the range of the past couple of years.
We’ll continue to keep this indicator at a green light for the moment, but I’ll be watching it to confirm that the positive trend of job growth continues.
Yield Curve (10-Year Minus 3-Month Treasury Rates)
Signal: Green light
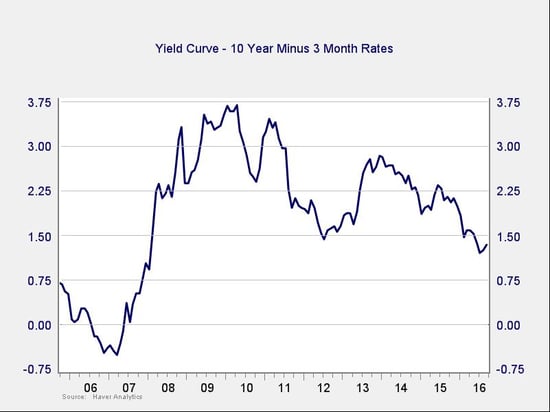
With Janet Yellen and the Fed maintaining that the U.S. economy is in reasonable condition—and other officials hinting that interest rates are likely to go up by the end of the year—rates for the 10-year Treasury rose over the past month. The net effect was that the spread between short- and long-term rates rose further.
Though the spread remains at a low level, this indicator is outside the risk zone, and the possible change in trend is encouraging. The negative risk here is also much smaller than with the other indicators.
Consumer Confidence: Annual Change
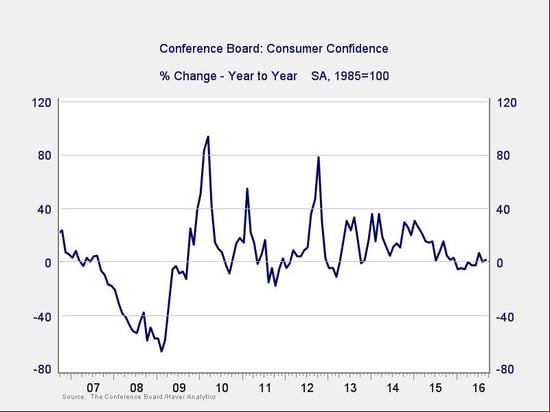
Signal: Yellow light
Consumer confidence increased substantially for the second month in a row, beating expectations again, and the year-on-year growth rate has ticked back up. Thanks to the repeated positive surprises, and the year-on-year change moving back above zero, this indicator remains well away from the trouble zone and appears to be improving. Although business data is weak, consumers continue to grow both earnings and spending, and rising confidence should keep this indicator at its current healthy level.
That said, the current improvement is based on consumers feeling good about the present—and the Conference Board survey shows they feel less positive about the future. Though the improvement of the past two months is real, given the volatility in other data points and lower future confidence numbers, I’m leaving this at a yellow light until we see another month or two of positive news.
Conclusion: Economy healthy, but negative trends still possible
Business confidence has become very volatile, making this month’s good news somewhat less encouraging. Nonetheless, we do see a real improvement. Although consumers remain confident, the recent slowdown in employment growth and concerns about the future suggest their sunny outlook might be vulnerable as well. While good news this month has interrupted the weak trends of the past two quarters, one month is not sufficient to make that call. The good news is welcome, but more as a signpost than a destination.
The risk level remains elevated, although less than last month, and we certainly need to watch how the economy evolves. Given the generally healthy levels of the data before last month, however, and the wide range of good news this month, I'm leaving the overall indicator at a green light.


