

 Print
PrintIn yesterday’s post, we concluded that a recession is the biggest and most consequential indicator of a bear market. The next obvious question is, how can we spot a recession coming?
Fortunately enough, this is something I analyze on a monthly basis. Although there are literally hundreds of economic indicators you can watch, I focus on four metrics that have excellent track records of signaling looming recessions about 18 to 24 months ahead. They are:
- Changes in the service sector, expressed by the ISM Non-Manufacturing Index
- Changes in employment
- Whether the Fed continues to stimulate the economy, expressed by the difference between the 10-year and 3-month Treasury rates (better known as the yield curve)
- Changes in consumer confidence
As you can see below, though risks continue to increase, the likelihood of an immediate recession remains low. In fact, given the typical lags involved, any recession seems unlikely (but not impossible) until around 2018.
That said, the news this month is not very good. After a break over the past couple of months, some of the potentially worrying downward trends have resumed. With the ISM Non-Manufacturing Index decreasing, job creation down sharply, and consumer confidence moving back to an annual decline, the weakness continues the trends of the past year or more, despite improvements in recent months.
The Service Sector
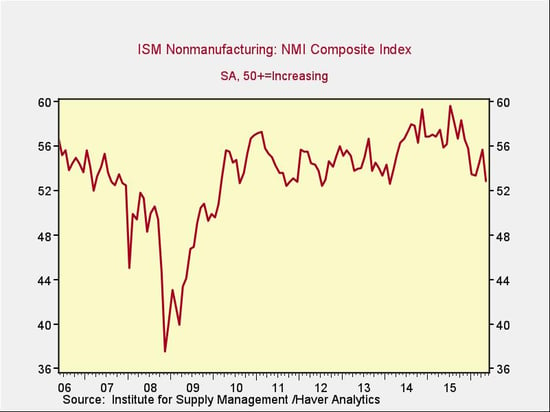
Signal: Green light
This metric has dropped back down close to its lows since the financial crisis. After the worrying decline late last year, the failure of the recent bounce suggests a sharp recovery is now unlikely.
This certainly doesn’t spell doom—the index remains well within the growth zone—but at best, it indicates a more cautious stance going forward, especially given that consumer spending has been improving. We can still expect continued business and employment expansion, but we may have to revise our expectations down. Continued strength in the service sector is consistent with business confidence; as a representative sample of the largest sector of business, this is an important leading indicator.
Private Employment: Annual Change
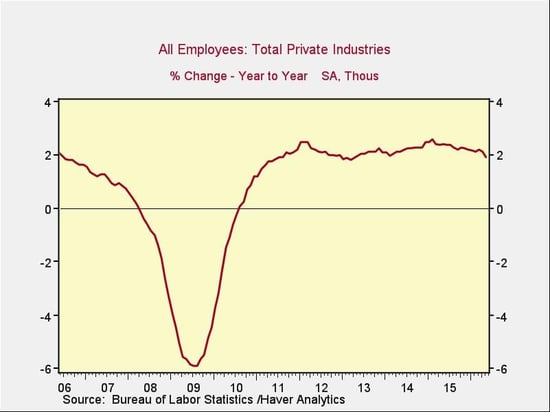
Signal: Green light
Again, after a bit of a bounce, employment has seen some decay back to lower levels. I’m going to take this one with a grain of salt, as the most recent employment report was affected by the Verizon strike. Job creation, at an annual percentage rate, remains at levels consistent with those of the mid-2000s, but the trend is getting worse. The next couple of months will be critical to see if it stabilizes around those levels.
Because this is an annual figure, the changes are slower and smaller than those we see in more frequently reported data. Overall, given the volatility of employment growth, this remains a green light.
Private Employment: Monthly Change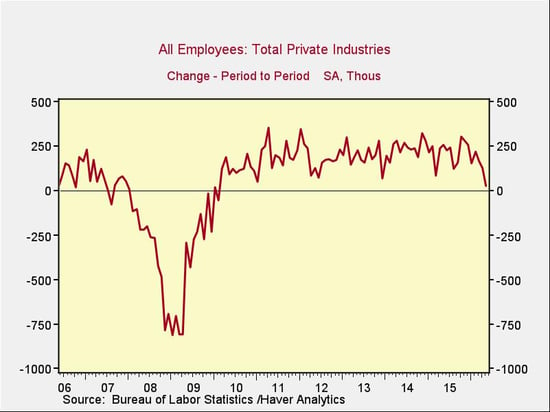
Signal: Green light (but needs to be watched)
These are the same numbers as in the previous chart, but on a month-to-month basis, which can provide a better short-term signal. May’s job creation was the worst in the past five years, but taking the Verizon strike into account, it’s not quite as bad as it seems. Similar declines have happened a couple of times before in this recovery, so there is no need to panic. Still, there does seem to be a noisy downward trend over the past couple of years.
I’m keeping this metric at a green light, given the uncertainty around the strike numbers, but the risk of moving to yellow-light status in the next couple of months is very real if jobs continue to disappoint.
Yield Curve (10-Year Minus 3-Month Treasury Rates)
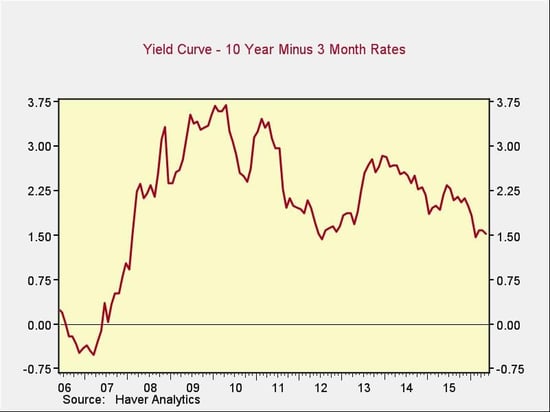
Signal: Green light
Rates for the 10-year Treasury bounced around slightly over the past month, while 3-month rates ticked up, and the spread between long-term and short-term rates narrowed accordingly. The spread is still at healthy levels, but the trend remains generally negative as the yield curve continues to flatten. The negative change here is much smaller than in the other indicators, but it remains a risk.
Consumer Confidence: Annual Change
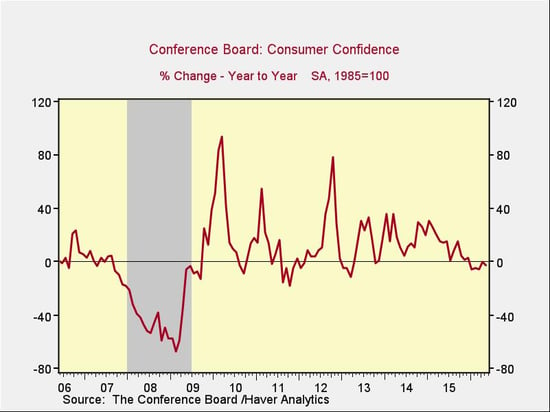
Signal: Yellow light
Consumer confidence decreased slightly this month, as did the year-on-year growth rate, bringing the year-on-year change back below zero. This is the third year in a row we have seen a difficult first quarter, and although consumers have started spending recently, confidence hasn’t really reflected that. By moving back below zero, the year-on-year growth rate suggests that recent weakness may not have been seasonal, keeping this metric at a yellow light.
Conclusion: Widespread trend decay raises risks (but not immediately)
The wide range of declines in these metrics largely reverses the improvements we saw over the past couple of months, suggesting that the weak trends of the past two quarters may continue. It’s worth noting that we’ve seen pullbacks like this before in the recovery. Worst case, given the usual lags for these trends, any trouble they indicate likely wouldn’t show up until 2018.
We certainly need to watch how the economy evolves, but I’m leaving the overall indicator at a green light. Even if the trends are unfavorable, the metrics are generally at healthy levels. The data over the next several months should help determine whether we have a real set of negative trends on our hands, or just one more slowdown.


