

 Print
Print All right, going on vacation was a mistake. The market started dropping just before we left and has recovered upon our return. Sorry about that. Now that I am back, though, we can be confident that the market will keep rising. Right? Right?
Maybe not, but the real issue here is not whether the market will keep rising—that is a consequence, not a cause—but whether confidence, which has kept the economy expanding and the market rising, will persist. While the base case remains that it will, the risks are rising that confidence might break. And that is what could spell the end of the expansion. With all the trade war headlines, this is what I’m watching.
Business confidence
Let’s start with business confidence, specifically manufacturing. This sector has been one of the most affected by the trade war. Combine that with slowing growth around the world, and you can certainly understand why confidence is down so much over the past year or so, as shown in the below chart. Businesses are clearly worried.
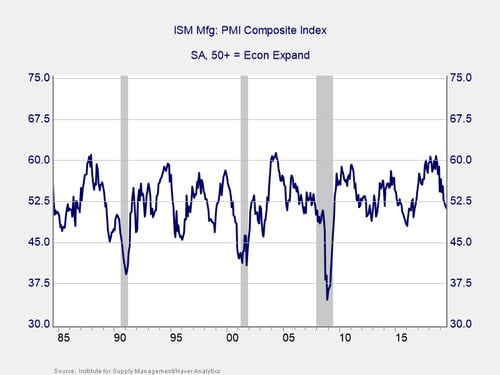
And yet, manufacturers are still more confident than they were in 2012–2013 and 2016. In fact, since this is a diffusion index, where values above 50 indicate expansion, the confidence level shows manufacturers still expect to grow. That’s kind of a big hint that things might not be as bad as all the headlines suggest. Another big hint is that over the past 35 years, manufacturing confidence has usually been lower than it is now even as growth continued. While conditions are not as good as they were, they are still pretty good.
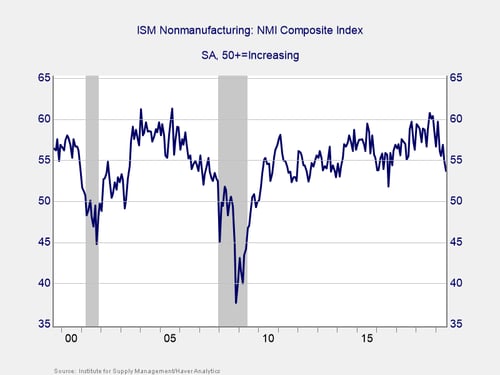
The service economy. One of the reasons manufacturing confidence can decline that much and still allow the economy grow is because manufacturing makes up only about one-eighth of the economy. The remaining seven-eighths consist of the service economy.
When we look at confidence here, we see a better picture. Confidence is indeed down, but it remains near the average level for the recovery so far—which is well in the expansionary zone. The trend over the past couple of months is negative, but we have seen this play out a couple of times before in the past decade, only to see confidence numbers stabilize and bounce higher. Once again, the actual data shows conditions are better than the headlines would suggest.
What about the consumer?
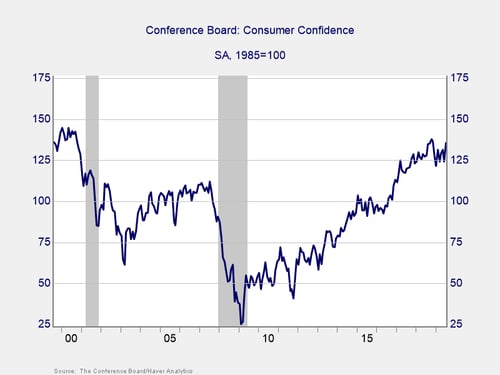
With business continuing to be cautiously optimistic on the whole, what about the consumer? Just as the service sector is much larger than the manufacturing sector—and, consequently, more indicative of the economy as a whole—consumer spending comprises a much larger proportion of the economy than business spending. Consumer spending is what really drives economic growth.
Here, too, the news is much better than the headlines suggest. Consumer confidence remains well above the levels we saw in the mid-2000s and close to those of the late 1990s. Consumers are feeling very good, according to this survey from the Conference Board, and this is supported by the recent retail spending data.
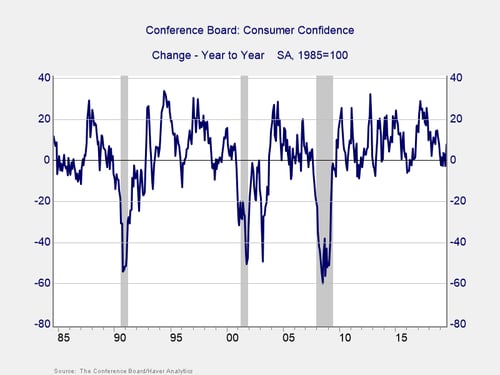
As regular readers know, though, what matters most for this series is not the absolute level but the change over time. A drop of 20 points over the previous year typically signals a recession, but here, too, the news is good. The year-on-year change is well above the danger zone and has actually ticked up over the past month.
Prospects for continued expansion
To sum up, despite the headlines, confidence actually remains solid, so the prospects for continued expansion are good. That said, this also tells us what we need to watch, so we can see when the headline risks start to turn into real risks.
I will be watching consumer confidence closely, followed by service sector confidence. When they start to slip into the danger zone, it will be a sign that the headlines have finally spooked the markets in a meaningful way.
A note of thanks
One more thing. I want to extend a sincere thanks to our guest bloggers from the past couple of weeks. We have some incredibly talented people here in the Commonwealth Research group, and I hope you enjoyed and appreciated their insights as much as I did. Going forward, we will make their inclusion a regular occurrence, usually on Fridays. Up first at the end of this week will be Anu Gaggar’s take on the events in Hong Kong and what they mean for investors.


