 I’ve had a lot of conversations recently about investment performance. Many people are reviewing their results, comparing them with what they expected and have received in the past, and asking themselves, Why are my investments doing so badly?
It’s a reasonable question. Investors, especially here in the U.S., expect to make money most years. You can count on a bad year every so often, and even very bad years. But after a weak 2014 and an even weaker 2015, it makes sense to wonder what’s going on here.
Diversification is the name of the game
To understand why our investments may have disappointed, we have to consider how investment portfolios are built. The core idea here is diversification—basically, not putting all your eggs in one basket. This strategy can help you avoid getting caught in a particularly bad area, but it may also limit your exposure to particularly good areas.
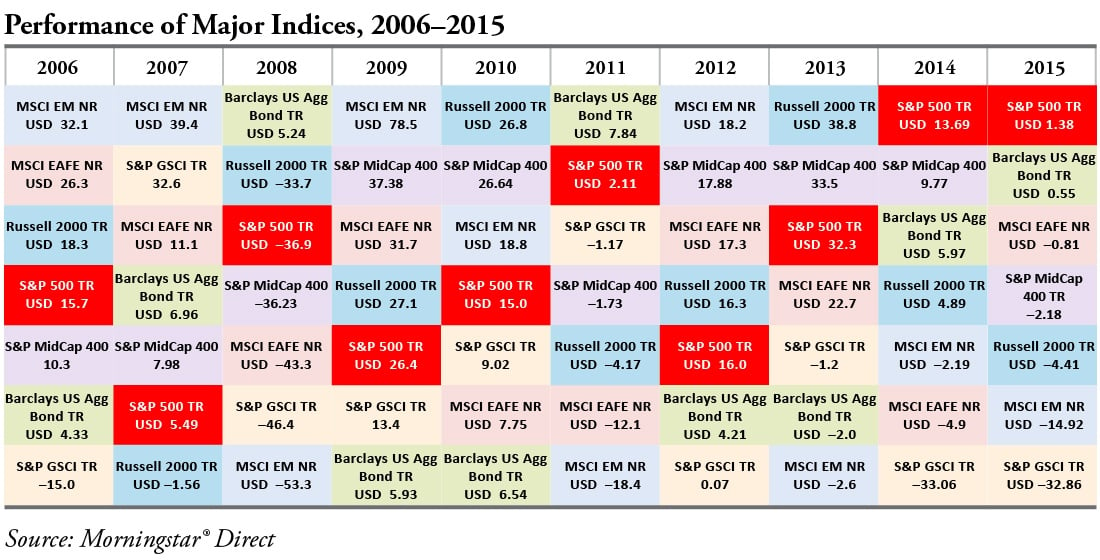
Most years, this has worked well. Looking at the chart below, you can see that, from year to year, the best-performing asset classes vary significantly, and the performance of individual ones bounces around quite a bit.
Emerging markets, for example, went from best to worst from 2007 to 2008, and back to best in 2009. Given this volatility (and the near impossibility of picking the best performer ahead of time), it makes sense to spread out your bets in the expectation that you’ll benefit from the best and get hurt less by the worst.
The underlying assumption here, though, is that most asset classes will perform well and several will perform similarly. By and large, this has been the case. In all but 3 of the past 11 years—2015, 2011, and 2008 being the exceptions—several asset classes have generated double-digit returns, and relatively few asset classes actually lost money. A diversified portfolio would have done well with that many gainers and few losers.
But, in a year when things look good in only one area and others don’t fare so well, like 2014, you will have less exposure to the good area and substantial exposure to the bad—and underperform overall, especially with respect to the area of strength. When that year is followed by one where nothing does well, like 2015, you find yourself where we are right now.
An outlier period for returns
Looking at it this way, we can start to see why the past two years have been disappointing. In 2014, only two asset classes, both U.S. stocks, did well. What’s more, we saw losses in several asset classes, which pulled down relatively low returns even more. The less exposure you had to U.S. stocks, the worse you did.
2015 was in many ways the same—but even worse. U.S. stocks once again outperformed, but with a gain of just over 1 percent, they certainly didn’t lift returns overall. With five of seven asset classes losing money, there was really no place to hide. In this market environment, any portfolio would have underperformed expectations.
After 2014, you could have argued that the best solution would be to overweight U.S. stocks. Looking at recent history, however, this has been a bad bet most of the time. Per the chart above, the S&P 500 has only been the top performer in two years: 2014 and 2015. It’s been outperformed by emerging markets in 5 of the past 10 years, by developed international markets in 4 of the past 10, and even by U.S. small-cap stocks in 6 of the past 10. And in 2015, despite its outperformance, the S&P 500 still didn’t generate substantial returns.
Over time, investing more in large U.S. companies simply hasn’t been the best strategy.
Bottom line: diversification may be your best bet
In many ways, 2014 and 2015 were exceptional years. Stocks of large U.S. companies were the only ones that did well. Most other investments did not do less well; they did poorly. Any diversified portfolio would underperform in that situation, even as it would have potentially outperformed in a more typical year.
This is the worst two-year performance in a decade or more, and it is unusual but not unprecedented. In any market cycle, you occasionally see periods during which asset classes move in tandem. We have reaped the benefits of coordinated upward moves in the past—take 2009 and 2010, for example. Now, unfortunately, we are seeing the flip side of that.
In the end, though it’s easy to be disappointed by investment performance over the past two years, it is just one of the inevitable outliers that result from a diversified strategy. Over time, we will see good periods and bad periods, but a diversified approach can potentially help maximize performance and reduce risk compared with a more focused strategy.
The key is not to get so caught up in the short-term concerns that you forfeit the longer-term gains.


 Print
Print


