

 Print
Print Brad here. “Value” is an often-mentioned word, but few people have really considered what it means in the context of the whole economy. A short while ago, Pete Essele, one of Commonwealth’s most senior portfolio managers, wrote a post for this blog in which he discusses value investing and its underperformance. That was the first part of the story. Here, he takes a deeper look at why that underperformance happened—with very interesting implications for the future. Take it away, Pete!
Two weeks ago, I wrote a post highlighting the fact that the value premium has been mostly nonexistent since the early 1990s, a point acknowledged by Eugene Fama and Kenneth French in a recent paper titled “The Value Premium.” In that post, I established the what and set the stage for why, which I will address today. Specifically, I’d like to shed light on why value has underperformed growth over the past 30 years and what we can expect from the value sector moving forward.
Back to the future
The year 1985 offered the world one of my generation’s greatest movies, Back to the Future, remarkable in many ways but not least for the accurate picture it presents of our past economy. If we had the luxury of taking a trip back in time in Marty McFly’s DeLorean, we would gather a very different view of markets and the economy compared with what we see today.
The economy in the pre-1990s era was driven by an engine that relied on energy, materials, and industrials, which are considered the traditional value sectors. This fact is evidenced by the largest constituents in the S&P 500 in 1985, as shown in the chart below.
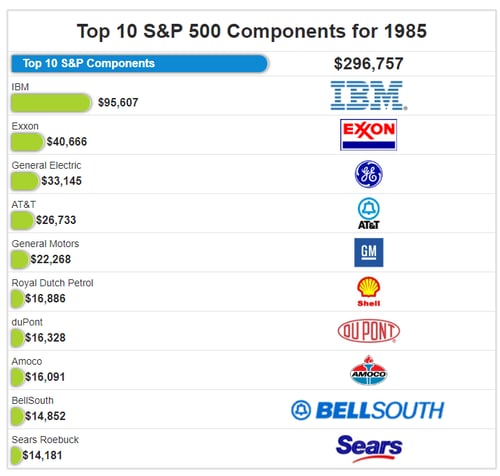 Source: ETFDB.com
The market view today
While energy, materials, and industrials accounted for 35 percent of the S&P 500 in 1985, this group represents only 13 percent today. Technology and communication services, on the other hand, have grown from 19 percent to almost 40 percent over the same time period!
Why? The market has changed because the economy has changed. How that happened over the past 30 years is often referred to as the “third industrial revolution.” Today, it’s possible the world has entered its fourth revolution, in which an economy based on brick-and-mortar institutions and the depletion of natural resources is giving way to firms valued for intangibles, ingenuity, and intellectual capital. The speed of current breakthroughs is advancing exponentially rather than linearly. Globalization and the immediate access to data have accelerated the momentum, and “growthier” companies have benefited greatly from the transition, particularly in the technology and communication services sectors. This transformation comes through in the data, with the Russell 1000 Growth Index handily outperforming the Russell 1000 Value Index over the past decade, as we can see in the graph below.
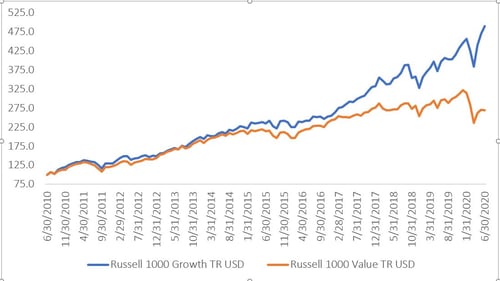
Source: Morningstar Direct
Value versus growth
Many proponents of value investing have compared today’s growth environment to the dot-com bubble of the late 1990s, claiming that value will outperform when the growth bubble bursts. I would advise against that comparison because today’s dominant tech companies command lofty valuations for a reason. Companies demonstrating outperformance over recent years (e.g., Google, Apple, and Microsoft) have established business models, wide “moats” protecting their long-term viability, and sustainable competitive advantages. In the late 1990s, on the other hand, lofty valuations occurred in firms with no earnings, premature business models, and no particular competitive advantages. As such, the valuation run-ups may look similar, but the economic foundations are very different.
Another argument posed for value outperformance moving forward is that the asset class looks relatively inexpensive. A closer look under the hood suggests otherwise. Certainly, some sectors within the value class look inexpensive on a relative and absolute basis (e.g., financials and energy). But many other sectors are trading well above long-term averages (e.g., utilities and consumer staples). Since financials and energy make up roughly one-quarter of the Russell 1000—the most widely recognized value index—valuations may look attractive for the space as a whole, but it’s just two sectors helping to compress overall valuations.
A call for value outperformance from a valuation perspective is really a call for financials and energy to perform well. In an environment with a flat yield curve, such as we’re now experiencing, the financial sector will see margins compress, which will weigh on earnings. As for energy, that sector is experiencing significant structural headwinds due to low commodity prices and a push toward sustainability and green tech. Therefore, it’s difficult to envision a scenario in the near term that would favor a strong rotation of funds into financial and energy companies. Without significant monies moving in this direction, it’s hard to imagine how value will outperform.
The outlook for investors
As an investor, you should ask yourself whether growth or value is better positioned for the next decade. The economy of the 1960s, 1970s, and 1980s was very different than that of today. The past economic environment served the value sector well, as I explained in my earlier post. Comparing today’s value market, however, to one that existed decades ago is akin to comparing a Tesla to a DeLorean. It’s an apples-to-oranges comparison that probably won’t serve your portfolios well. Value firms performed strongly in a goods-producing world, but it’s unlikely they’ll experience the same level of performance and valuation expansion in a service-oriented one, where the environment has clearly favored growth.


