

 Print
Print Brad here. One of the recent concerns about the economy has been the housing market slowdown. Housing involves not only home sales but also many ancillary activities (e.g., construction and financing). It is a significant economic actor in itself and a good indicator of how consumers feel overall. Housing is also at the center of many people’s economic decisions. In fact, I get more questions about housing than about anything else from employees here at Commonwealth. For today, Pete Essele has put together a good look at the current market and how it is likely to evolve over the next several months. Thanks, Pete!
As the Fed twists and the stock market shouts, the housing market is starting to exhibit some interesting dynamics as well, as noted in one of Brad’s recent posts. For the first time since early 2015, the year-over-year increase in national home prices stands at just more than 5 percent. Although most homeowners would be happy with that type of increase, especially those who owned homes during the financial crisis, consumers should really be focusing on the trend as of late.
The dynamics of supply and demand
To help illustrate this trend, we can turn to an indicator developed by Commonwealth’s Investment Management and Research team that looks at the dynamics of supply and demand, as well as how they affect home prices over time. Since the three are very closely related, current sales (demand) relative to housing supply should tell us something about the direction of housing prices in the near term. The chart below is a graphical representation of this theory, where the one-year percentage change in home prices is shown in dark blue and the demand-supply index in light blue. The latter represents the number of monthly homes sold divided by the number of homes for sale.
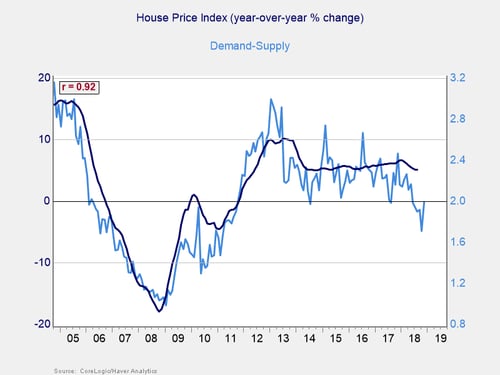
When the demand-supply line increases, it means that sales (demand) are outpacing supply; when it trends lower, it indicates more supply than sales. Over time, the demand-supply line has done a good job of tracking changes in housing prices, as noted by the downturn in the financial crisis and subsequent move higher in the recovery. Interestingly, the light blue line tends to trend a few months ahead of housing prices, so it can be used as a leading indicator.
Currently, the demand-supply line suggests a continued slowdown in year-over-year home prices over the coming months, particularly if it remains in its current range with the next release.
What’s behind the slowdown?
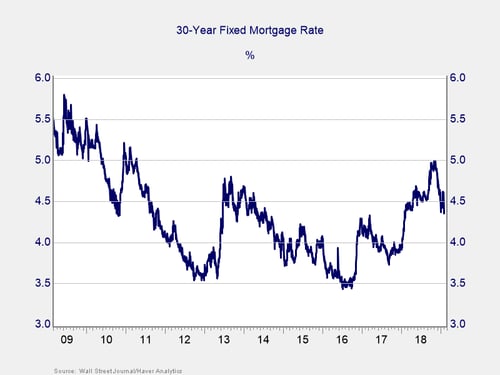
One of the main culprits in the housing slowdown in the latter portion of 2018 was interest rates. Starting the year at an average of 3.92 percent, 30-year mortgage rates continued to move higher before peaking in early November at 4.99 percent, the highest level since 2011. For your average home buyer, the difference was a 13-percent increase in an initial monthly mortgage payment compared with just 11 months earlier. Consumers took note; as a result, demand slowed in the closing months of the year.
The drop-off in demand is probably best explained through the Composite Housing Affordability Index, a measure used by the National Associate of Realtors to assess the attractiveness of the housing market from a buyer’s perspective. A rising index indicates more buyers can afford to enter the market, and a declining index means it is becoming less attractive.
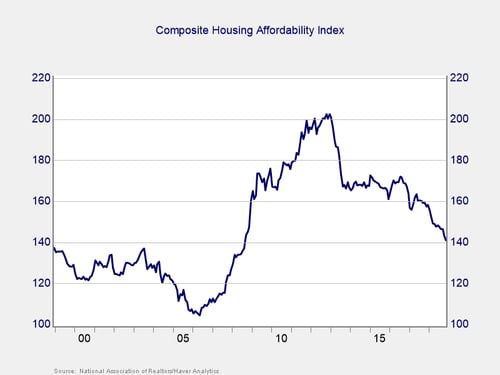
Note the steady move lower throughout the year in the index, which was due to the combined effect of rising financing costs (as noted above) and increasing home prices. The double whammy pushed buyers to the sidelines while supply built up, causing the slight moderation in prices.
What’s next?
As noted above, one of the single-largest determinants of housing demand is mortgage rates. Therefore, the path of rates over the course of 2019 will have a large bearing on the direction of things. Housing prices should move to the upside if interest rates remain stable (or move lower) and the economy and jobs growth continue to meet expectations. On the other hand, if interest rates continue an upward trend in a relatively short period of time and/or the economy and jobs market continue to soften, housing may come under additional pressure.
A barometer of economic health
Although housing in and of itself accounts for only about 4 percent of GDP, the multiplier effect is a magnitude beyond this because of the number of businesses that are generally involved with a home purchase. To name just a few, realtors, home inspectors, and home improvement stores are all benefactors of the home purchase market. Positive developments in housing throughout the coming year will have a ripple effect into many tangential areas, offering a tailwind for the economy. Therefore, housing is often looked at as a good barometer for the overall health of the domestic economy.


