

 Print
Print Brad here. Today's post on the growing disparity we're seeing between growth and value stocks is brought to you by Peter Roberto, an investment research analyst on Commonwealth’s Investment Management and Research team. Take it away, Peter.
Since the end of the first quarter of 2017, we’ve seen growth stocks, which can increase their revenue and earnings at a faster rate than their competitors, outperform value stocks, which have solid fundamentals but are priced below their peers. This shift has only gained momentum since the stock market lows of March 2020. Here, we’ll take a look at how this current run stacks up to two of the more famous growth periods: the dot-com era and the “Nifty Fifty.”
Where we are today
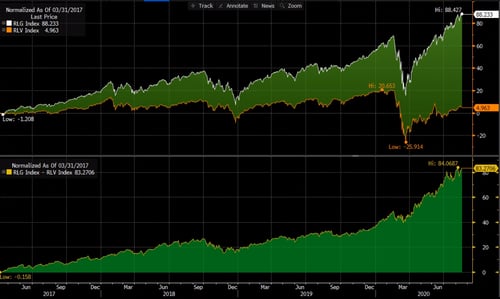
Let’s start by looking at where we are now, using the Russell 1000 Growth and Russell 1000 Value indices as proxies to illustrate the diversion in growth and value over the current run.
In the top panel of the first chart below, you’ll see the performance of the Russell 1000 Growth and Russell 1000 Value indices (in percentages) from March 31, 2017, through August 17, 2020. The bottom panel shows the spread between the two over the same time frame, topping out at 84.1 percent over 40.5 months.
Source: Bloomberg
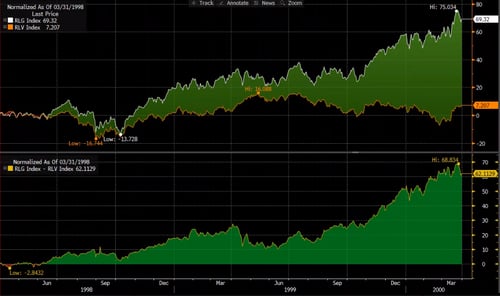
In the next chart, we see the spread between the same two indices from June 1998 to March 2000. The spread topped out at 68.8 percent over the course of just 22 months.
Source: Bloomberg
Taking a look back
The current spread appears to be larger in magnitude than that of the dot-com era, but the pace at which it has occurred is nearly double the time frame. We should also highlight the notable expansion in the spread following the market bottom in March 2020, with spreads between growth and value widening 24.53 percent between March and June/early July.
Unfortunately, the Russell 1000 indices do not go back to the 1950s, 1960s, and early 1970s when the Nifty Fifty was at its peak. (Nifty Fifty is a term coined to refer to a group of 50 large-cap stocks that were considered appropriate for a buy-and-hold strategy. No matter the price you paid, the argument went, the stability and growth of these companies would make them good investments.) That said, we do have evidence of the premium these stocks demanded over their peers, as this quote from a 1977 Forbes magazine article reveals:
What held the Nifty Fifty up? The same thing that held up tulip-bulb prices in long-ago Holland—popular delusions and madness of crowds. The delusion was that these companies were so good it didn’t matter what you paid for them; their inexorable growth would bail you out.
This situation led to an average price-to-earnings valuation multiple for these 50 stocks to a level 2.2x that of the S&P 500 Index. These names were also particularly concentrated, so much so that the top 10 stocks were more than 50 percent of the S&P 500 and the top 4 stocks represented 18 percent of the index.
Breaking down the numbers
So, how do the premiums and concentrations of today stack up to those of the Nifty Fifty and dot-com eras? Today, 45 companies make up 50 percent of the S&P 500 versus 33 companies during the peak of the dot-com era in 1999. Today, the Russell 1000 Growth Index trades at 40x earnings, roughly 1.7x that of the S&P 500. During the dot-com era, it traded as high as 60x earnings, representing 2x that of the S&P at the time.
If we look at other indices such as the Nasdaq 100, we do see indices of higher concentration, with the top 10 companies representing more than 50 percent of the index. In fact, in 2000, the five biggest companies composed 14 percent of the S&P 500 but contributed only 2 percent of the overall cash flow. Today, five stocks represent roughly 20 percent of index—but contribute a proportional amount of cash flow.
What can we expect going forward?
There are two things we can say for certain: the S&P 500 will continue to change, and growth will not outperform value in any given period. In fact, a 2018 study from Innosight found that the average tenure of companies in the S&P 500 dropped from 33 years in 1964 to 24 years in 2016. Further, over longer periods following the dot-com era, we have seen value outperform growth.
Given all of this, it’s important to know what you own and evaluate whether there may be unintended concentrations within your portfolios.
The Russell 1000 Growth Index is a market-capitalization weighted index of those firms in the Russell 1000 with higher price-to-book ratios and higher forecasted growth values.
The Russell 1000 Value Index is a market-capitalization weighted index of those firms in the Russell 1000 with lower price-to-book ratios and lower forecasted growth values.


