

 Print
Print Today’s post is from Brian McCormick, a manager on Commonwealth’s Investment Management and Research team.
On December 20, 2017, Congress passed the Tax Cuts and Jobs Act. This legislation included a significant reduction in the corporate tax rate, from 35 percent to 21 percent. As such, I think it’s worthwhile to take a closer look at the effect of tax reform on earnings per share (EPS). EPS is important to investors because it is a very good indicator of how profitable a company is and how much money it is making for its shareholders. EPS can be used to compare companies within the same industry and to see how much the earning power of a company has improved or deteriorated over time.
Wall Street expectations
After the act was passed, many Wall Street analysts increased their earnings expectations ahead of the fourth-quarter earnings season, anticipating a big increase in EPS moving into 2018.
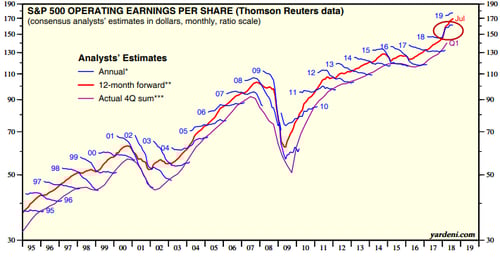
*Spans 25 months from February to February.
**Time-weighted average of consensus operating earnings estimates for current and next years.
***From Thomson Reuters I/B/E/S.
Source: Thomson Reuters I/B/E/S.
To put this in perspective, historically, EPS estimates for the S&P 500 will start higher and move lower over time as analysts get a better picture of company financials. But tax reform helped reverse this trend in 2018—pushing estimates significantly higher during the start of the year at a rate we have not seen in recent memory.
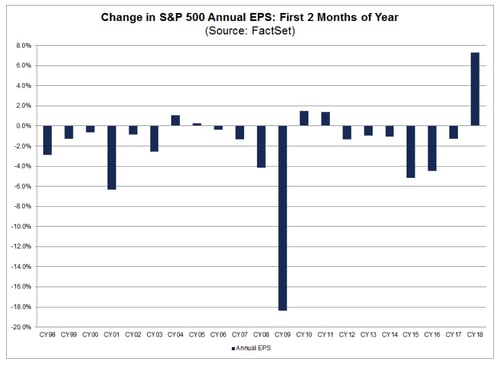
Source: FactSet
After taxes
EPS is calculated as follows:
EPS = (Net Profit After Taxes/Weighted Average Shares Outstanding)
The words after taxes are underlined because that part of the equation was greatly affected for most companies after the tax bill was passed. It was also the reason for the sharp upward revision in EPS for the S&P 500 and the main reason why we are seeing the highest earnings growth rate within the index (24.8 percent in the first quarter of 2018) since the third quarter of 2010.
While tax reform has certainly been a nice gift to shareholders, it is important for investors to keep the other parts of this equation in mind as we head toward 2019. Perhaps the upward revision in EPS is not 100 percent from tax reform. The steady rise in oil prices has certainly helped the energy sector, and rising interest rates have had a positive effect within the financials sector.
Nonetheless, as the chart below indicates, the vast majority of earnings growth has come from tax reform. The earnings growth estimate for the third quarter of 2018 was 10.9 percent just a few weeks before the tax bill was passed. Now that estimate stands at 21.2 percent.
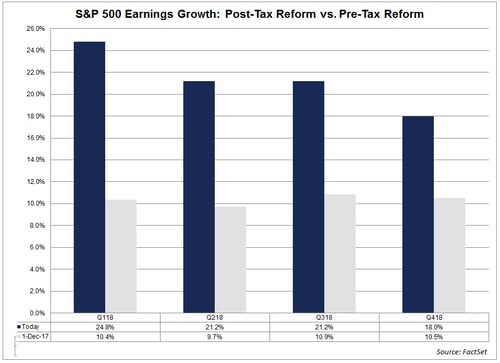
Source: FactSet
Before taxes
The real question moving forward will be how much of the S&P 500 EPS growth is being driven by the growth of the economy and corporate profits before taxes. Earnings growth will almost certainly slow in 2019. Why? Because we take the reduction in tax rate out of the equation. Plus, we won’t have the massive rebound in energy earnings like we had from 2017 into 2018, which has been a boost to earnings growth this year.
Earnings growth for the S&P 500 is expected to drop down to 10.3 percent in 2019 from the 20.5 percent estimate that we are currently seeing for 2018. So, as great as earnings are right now, it is important to realize that this is a one-time boost to profits due to the reduction in the corporate tax rate.
Shares outstanding
Finally, tax reform could affect the last part of the EPS equation by potentially reducing the number of shares outstanding. The tax cuts are a huge boost to corporate profits. Some corporations have been using the additional cash to buy back shares; this will reduce the number of shares outstanding, thereby increasing a company’s EPS. Apple has already announced a record-breaking $100 billion buyback program, much of that coming from $252 billion in foreign profits that came back into the U.S. because of the tax bill. Apple was an exceptional case in this regard, but other companies have also been buying back shares in record numbers as well. Cisco Systems is buying back $25 billion worth of stock, Wells Fargo $22.6 billion, Pepsi $15 billion, and Amgen $10 billion, just to name a few.
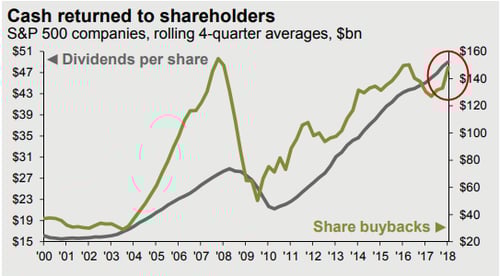
Source: BEA, Bloomberg, Compustat, FactSet, Standard & Poor’s, J.P. Morgan Asset Management
It will be interesting to monitor share buybacks in the coming quarters, as this could affect the EPS growth of the S&P 500 significantly.
What about 2019 earnings?
Tax reform has obviously had an extraordinarily positive impact on EPS growth in 2018. But this is a singular event that has made EPS numbers on the S&P 500 exceptional for 2018. Heading into 2019, we will be back to focusing on more normalized earnings growth numbers and underlying fundamentals. The first-quarter earnings season in 2019 could give us a better idea of how companies are growing profits without the added benefit of a corporate tax reduction.
As I mentioned, there is no doubt that the earnings growth rate will slow significantly. Still, a rate of 10.3 percent, which is what analysts are currently forecasting, is very healthy. In fact, the median annual earnings growth rate dating back to 1990 is 12.01 percent. So, despite the drop off that we’ll most likely see in 2019, it is important for investors to understand that earnings will still be in good shape.


