 Now that summer is almost over (but not quite yet!), it’s time to start thinking about what the fall may bring.
Are we in for a September decline?
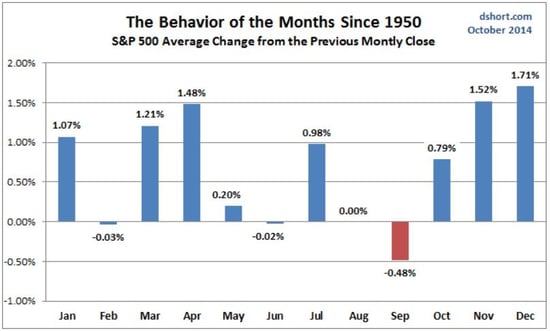
September is historically a volatile month for the stock market, and it’s the only month that has, on average, shown a decline since 1950, per this chart from dshort.com.

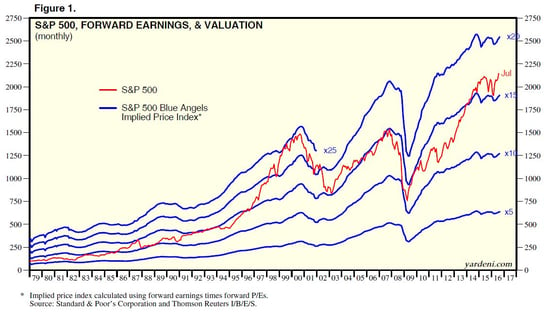
More recent charts illustrate the same effect, although with slightly different numbers. The next one, from Yardeni Associates, shows that valuations are at their second-highest level since 1979, below only those of 2000, and well above where they were in 2007.

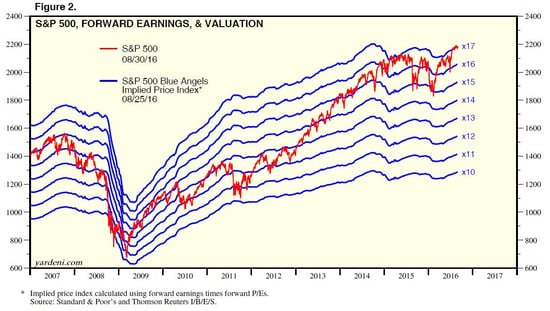
An even more recent chart, from the same source, also shows high valuations. Some kind of pullback seems quite possible.

Comparing the more recent data and the older data, however, something else becomes apparent. Valuations have moved to a higher plane in the past 30 years, and pullbacks during that time period have not been nearly as severe, from a valuation perspective, as earlier drops. In 2000–2003, for example, valuations dropped to only 15x; even in 2008, valuations fell to10x, well above the 5x valuations we saw in the late 1970s and 1980s.
There really does seem to be a higher floor for valuations nowadays, which should help cushion any pullbacks.
The other supporting factor, of course, is low interest rates, which probably explain a great deal of the higher valuations. With the Federal Reserve not signaling a rise in rates in September, and with other central banks continuing to stimulate, rates should stay low and continue to support markets.
Fundamentals likely to remain strong
Recent positive income and spending numbers show that consumers are continuing to drive the economy, and the surprisingly strong consumer confidence number yesterday reinforces that. Today’s good ADP employment number, though down from the incredibly strong levels of the previous two months, suggests employment growth continues to be healthy. With the industrial and manufacturing sector recovering, housing doing well, and even energy starting to recover on higher prices, the economic fundamentals look very likely to continue to improve through the month, supporting the market.
Still, expect some shocks
Given the low level of market volatility and current high valuations, I would not be at all surprised if markets bounced around in September. In fact, we’re overdue for some turbulence. At the same time, however, the fundamentals remain strongly supportive, which should limit any damage. History shows that serious pullbacks typically take place in times of economic stress and recession, and we just don’t see that at the moment.
In other words, September should be more of the same. Growth is poised continue, but the market may well move back and forth.
The real wild card over the next couple of months will be politics, not economics. If anything is likely to create a pullback, it’s the U.S. presidential race. Although I’ll be keeping an eye on the economic stats, the election is what really concerns me at the moment. Even there, however, the news may not end up being that important, despite any short-term effects.
Remain calm and carry on.


 Print
Print


