


Wow, that was quick. The markets celebrated Obama’s reelection with a quick drop as investors shifted their focus to the problems in Europe and the fiscal cliff here in the U.S. All three papers headlined with the fiscal cliff in one way or another this morning. The Wall Street Journal and New York Times (NYT) addressed it explicitly, with “Focus Moves to ‘Fiscal Cliff’” and “Back to Work: Obama Greeted by Looming Fiscal Crisis,” respectively, while the Financial Times (FT) caught up on the election with “Obama wins but new battle looms.”
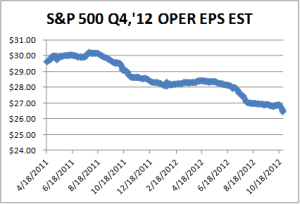
Yesterday’s market dip was significant, the largest of the year in both points and percentage for the Dow. It also took the market below psychologically significant breakpoints, at 13,000 for the Dow and 1,400 for the S&P 500, and put it closer to its 200-day moving average—another potentially important breakpoint. Now that we’re past the election, the market is focusing on the next set of challenges, and it doesn’t much like what it sees.


