

 Print
Print Brad here. Today’s post is brought to you by Andrew Kitchings, a portfolio manager on our Investment Management and Research team. Over to you, Andrew.
Much of the media coverage surrounding markets relates to emotions. When the market rises, we read about the excitement. When the market declines, we hear how investors are worried. This commentary can be very evocative, but it is not very useful. What does it even mean when the market is “scared”?
Enter the fear index, a term often used by the media to indicate that the markets will be entering a period of turbulence and perform poorly. What the headlines are actually talking about is the CBOE Volatility Index (VIX). Many view this index as a predictor of uncertainty in the market and, thus, as a measure of broader economic uncertainty. So, when the headlines say fear, they mean uncertainty. In market speak, these terms often mean the same thing.
What is the VIX?
Simply put, the VIX is a measure of uncertainty. It is based on the bets traders place on how much they collectively expect the market will fluctuate over the next 30 days. The index can trace its origins back to 1987. The modern-day version was launched in 1993; after some tinkering, the current version was launched in 2003.
Like any index, the VIX is a number. It has historically ranged from 9 to 80, with an average of 19 over time. Low numbers, which are values below 11, indicate traders expect an unusually calm environment. Values above 27, on the other hand, mean they expect trouble ahead.
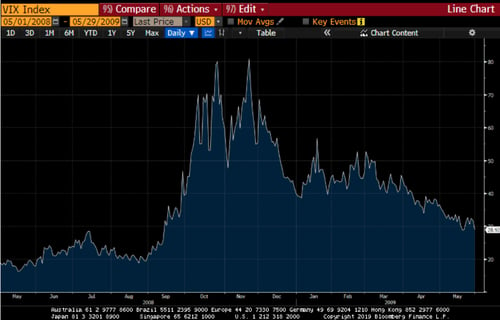
The VIX can change quickly. In September 2008, the VIX was trading at just under 19—meaning people, via options, thought things would remain relatively calm. But only a couple of months later, the VIX was trading at over 80 as the financial crisis worsened. So, the VIX was a good indicator that trouble was on the way, but it was not so good at predicting the market’s performance. The VIX did spike in November 2008, but the market didn't hit bottom until March, nearly four months later.
As with anything in financial markets, the VIX is affected by people’s biases and can overshoot and undershoot. Although the 2008 spike did indeed predict a crisis, that has not always been the case. The next similar spike, on February 5, 2018, saw the VIX index climb more than 100 percent, based not on actual economic and market risks but on technical factors within the markets themselves. So, while the VIX measure experienced a record one-day rise, it was not a good predictor of future trouble.
If not the VIX, then what?
Given the downsides of the VIX, it is helpful to look beyond the attention-seeking headlines and identify broader measures of market and economic stress. One of the best of these comes from the Fed of Kansas City. It publishes an index that gives a broader view of stress within the equity and fixed income markets and gives insights into the overall economy.
The Kansas City Financial Stress Index
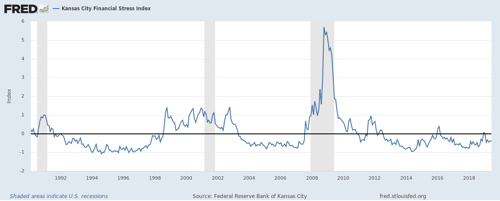
The Kansas City Financial Stress Index uses 11 different factors to identify if current financial stress is above or below long-term averages. This result can give investors insight into how the market and the economy are directionally doing. Ahead of the financial crisis, the stress index started moving higher in 2007 and moved above zero in August 2007, as cracks under the surface started to appear for the market and the economy. More recently, in 2015, the index moved incrementally higher with uncertainty appearing across the fixed income markets, in particular the high-yield market. In both cases, the incremental increases in the index shed light on cracks percolating outside of the headlines. Both times, this index was a timely and correct indicator.
Basically, the Kansas City index looks at a wide range of economic and financial factors, rather than just narrow trading action. Getting into the details of the exact factors (as discussed below) can be a bit daunting. But the factors can be narrowed down to two groupings—yield ratios and asset behavior—that describe what investors and markets are thinking.
Yield ratios. These ratios give an indication of how much extra investors want to be paid for taking on greater risk and less liquidity. In bad times, investors look to invest in higher-quality, more liquid securities because they are uncertain about the future. Thus, the Kansas City index compares a variety of bond markets relative to higher-quality equivalents. It uses ratios (dividing the yield of two securities) versus spreads (subtracting the yield from two securities), which allows for less distortion in low-rate environments. Also, using financing ratios of corporations and consumers gives insights into the broader economy.
Asset behavior. These indicators can be split into broad market and banking-related indicators. Banks are economically sensitive. During periods of stress, investors shun those banks that are deemed lower quality and prefer banks that are good quality. This preference creates a wide range of performance among the bank stocks when times are bad and a narrow range when investors are willing to take on more risk, which influences the stress index. The Kansas City index also uses two volatility measures, one of which is the VIX. The other focuses on the volatility of banks to help show if things are getting more volatile or less.
What about the St. Louis Financial Stress Index?
The St. Louis Financial Stress Index is another widely cited stress index. Indeed, at its core, it has many similarities to the Kansas City index. But the St. Louis index puts a greater weight on absolute yield levels that have been trending lower for a period. Also, rather than going “under the hood with bank stocks,” the St. Louis index merely looks at the price level of bank stocks. Here at Commonwealth, we look at all these factors. But for my money, the Kansas City index is the better measure.
Look below the headlines
Although the VIX is the media’s preferred indicator of stress within the market, the Kansas City Financial Stress Index does a better job of measuring broad stress across the market. More important, its directional movement can show stress is ebbing or flowing under the surface of the economy. The effect of the movement can be used as an indicator for investors about whether they should be wary of underlying market and economic factors rather than being blinded by flashy headlines from the media. Of course, it is important to watch the headlines. But paying more attention to the details underneath is necessary to properly manage your investments.


