

 Print
Print Today’s post is from Peter Roberto, an investment research associate on Commonwealth’s Investment Management and Research team.
After the presidential election in 2016, we saw domestic small-cap outperformance through the remainder of that year and emerging market outperformance in 2017. While these two segments have garnered much attention following their strong performance, one area that hasn’t gotten as much consideration is international small-caps.
Here, we will investigate the international small-cap space to clarify where the exposures lie from both a domicile and revenue standpoint, reasons for investing in the space, as well as the benefits and risks of international small-caps.
Revenue exposures
The chart below depicts revenue exposure trends in the Vanguard FTSE All-World ex-U.S. Small-Cap ETF. The pie chart in the top right shows the revenue outer ring versus the domicile inner ring.
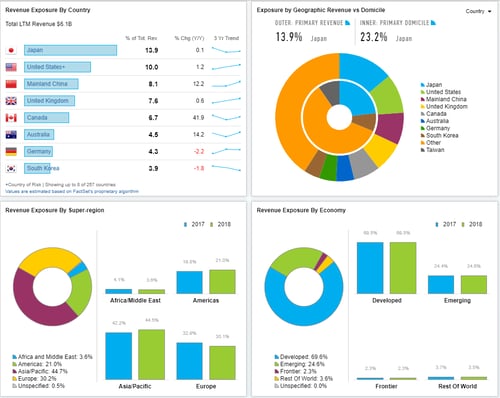
Source: FactSet
There are two major takeaways here. First, I would like to highlight U.S. exposure (top left chart) and the discrepancy between the domicile and revenue in Japan (top right chart). These both illustrate that while, traditionally, international small-caps have primarily generated revenues in their own countries and currencies, this scenario is not always the case. These figures also suggest that while smaller international companies are walled off and less affected by trade policy and the rest of the world, they are not entirely isolated. Indeed, they can be hurt if the country where their products are sold is adversely affected.
Second, I would like to point out the 24.6-percent exposure to emerging markets (bottom right chart). While we saw outperformance in emerging markets in 2017, backed by stronger profits and a tailwind from a weaker U.S. dollar, we have seen a shift back toward a stronger dollar in 2018. If we expand on these two points, we arrive at many of the benefits and risks of this segment.
Benefits and risks
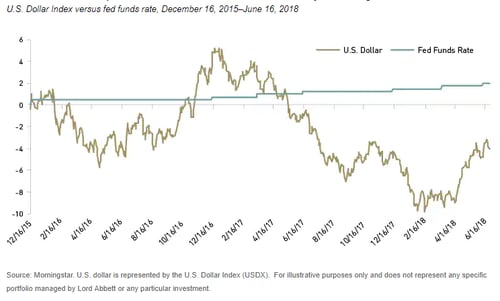
After remaining relatively range bound from the start of 2015 through most of 2016, we have seen a pickup in volatility in the U.S. dollar. Depending on which way the dollar moves, the relative strength of domestic currencies and emerging market exposure can be either tailwinds or headwinds for international small-caps. In 2016, a stronger dollar supported those small-caps that were less exposed to currency headwinds. In 2017, on the other hand, a weaker dollar helped support those emerging markets with a large amount of U.S. dollar-denominated debt.
Going forward, central bank policy will be a key factor to monitor, as we have begun to see the U.S. dollar move with the federal funds rate and with hikes in the U.K. In addition, Mario Draghi, president of the European Central Bank, has stated that the ECB will end quantitative easing at the end of 2018. Further, Turkey's central bank recently refused to hike rates to strengthen its own currency. It will be interesting to see how Fed policy affects near-term corporate profits versus keeping borrowing rates low and stimulating growth.
Why hold international stocks?
With continued outperformance from domestic stocks over recent years, we have seen some investors begin to ask, why hold international stocks?
In the chart below, we see the 3-, 5-, 10-, and 15-year annualized returns through July 31, 2018. As you can see, international small-caps have seen greater underperformance than the domestic indices over the past 10 years. But if we look at a longer time frame, such as 15 years, we see that they have historically outperformed these benchmarks, except for the Russell Midcap Index.
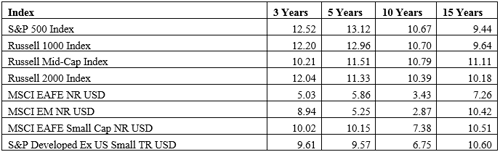
Source: Markov Processes International
In the case of international small-caps, they are traditionally less exposed to changes in trade policy since their revenues are typically sourced within their country. This, along with other factors, has led to a lower correlation to U.S. stocks and attractive risk-return characteristics.
In the chart below, you can see how the category is beneficial for diversification purposes. In addition, international small-caps look cheaper from a relative valuation perspective. (Although this data is as of September 30, 2017, we believe the point still stands. This data spans 20 years and multiple market cycles.)
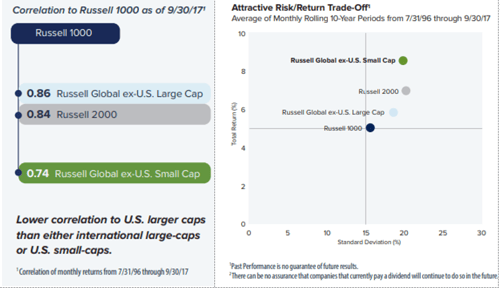
Source: Royce Funds
The next chart provides a comparison between the Russell 1000, Russell 2000, MSCI EAFE, MSCI Emerging Markets, and MSCI EAFE International Small-Cap indices (top to bottom). As you can see, international small-caps are near their five-year lows from a valuation perspective.
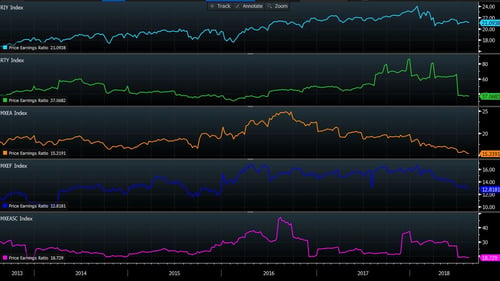
Source: Bloomberg
Know your portfolio
Of course, investors should make an effort to know what they own. We hope you find this overview of international small-caps helps you get to know your portfolio just a bit better.
The main risks of international investing are currency fluctuations; differences in accounting methods; foreign taxation; economic, political, or financial instability; lack of timely or reliable information; or unfavorable political or legal developments.
The Russell 1000 Index consists of the 1,000 largest companies within the Russell 3000 Index. It is also known as the market-oriented index because it represents the group of stocks from which most active money managers choose.
The Russell Midcap Index measures the performance of the 800 smallest companies in the Russell 1000 Index, which represent approximately 25 percent of the total market capitalization of the Russell 1000 Index value range. Any mid-cap stocks already included in the S&P 500 are excluded from this index.
The S&P SmallCap 600 Index includes 600 companies and represents about 3 percent of the U.S. equities market. To be eligible for addition to the S&P SmallCap 600, companies must have a market capitalization between $300 million and $1.4 billion.
The Russell 2000 Index consists of the smallest 2,000 companies in the Russell 3000 Index, representing approximately 7 percent of the Russell 3000 total market capitalization.
The MSCI EAFE Index is a free float-adjusted market capitalization index designed to measure developed market equity performance, excluding the U.S. and Canada.
The MSCI Emerging Markets (EM) Index is a free float-adjusted market capitalization index designed to measure equity market performance in the global emerging markets.
The MSCI EAFE Small Cap Index combines the MSCI EAFE and MSCI Small Cap indices.
The S&P Developed ex-U.S. SmallCap Index comprises the stocks representing the lowest 15 percent of float-adjusted market capitalization in each developed country, excluding the U.S.
The Russell Global Index measures the performance of the global equity market based on all investable equity securities. The index includes approximately 10,000 securities in 65 countries and covers 98 percent of the investable global market. All securities in the Russell Global Index are classified according to size, region, country, and sector.
The Russell Global ex-U.S. Large Cap Index includes the large-caps within the Russell Global Index, excluding those within the U.S.
The Russell Global ex-U.S. Small Cap includes the small-caps within the Russell Global Index, excluding those within the U.S.


