

 Print
Print Brad here. In today's post, Peter Essele, vice president of investment management and research, provides some perspective on the latest jobless claims numbers—and what we might expect going forward.
This morning’s initial jobless claims report revealed that more than 5.2 million individuals filed for unemployment insurance for the week ending April 11. This result brings us to around 22 million jobless claims since the start of the coronavirus crisis. At the current pace, unemployment could easily move beyond 10 percent in April, as almost all jobs created since the great financial crisis of 2008 have been lost in the past month.
The devil’s in the details
Let’s face it: this morning’s initial claims numbers were ugly. More than likely, they’re going to stay this way for the next few releases. There is, however, a silver lining in the details.
Up until this point, the lion’s share of job losses have occurred in a single sector—leisure and hospitality. This portion of the job market tends to be fairly transitory and fluid. In fact, of the 701,000 jobs lost in March, nearly two-thirds came from this sector alone. And when you dig even further into the details? The numbers show that more than 90 percent of the losses in this sector came from a single industry: food services and drinking places.
It’s quite possible that April’s payroll numbers (released the first week of May) will show a similar trend, particularly since many states didn’t quite enter full quarantine mode by shuttering businesses until the latter days of March. As such, many individuals didn’t begin filing for unemployment insurance until April, which most likely explains the recent surge in claims.
The telling piece in May’s release will be whether there has been a spillover effect into highly skilled sectors of the economy with specific requirements for hiring. Leisure and hospitality, for better or for worse, has a fluid labor force that tends to be very adaptable, and it has low barriers to entry. Therefore, while the headline numbers appear frightening, the containment of the fallout in a single sector and relative ease with which it can be reignited help explain why markets have been so resilient, particularly as new case counts have dropped.
Real-time insight on the labor market
One of the best ways to get a better understanding of the direction of the payroll situation prior to official releases is to use Google Trends. This portal allows users to gauge the popularity of certain search terms, such as unemployment insurance or, perhaps, Taylor Swift tour. Here at Commonwealth, we’ve determined that Google Trends can offer nearly real-time insight on the direction of the labor market, whereas payroll numbers come out only once per month and initial claims come out weekly.
For instance, prior to this morning’s release, the popularity of Google searches for the term unemployment insurance suggested that we would see the initial claims number come in around 5.2 million. That number is exactly where things ended up, as evidenced by the chart below. (The orange dotted section shows the official release data, which came in after 8:30 A.M.)
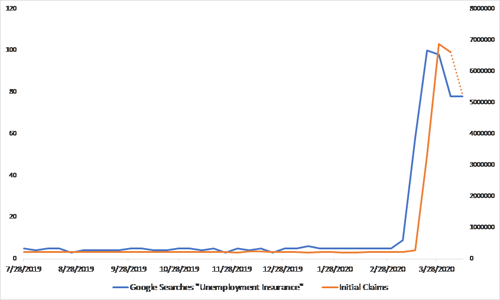
Source: Google Trends
In addition, the Google search data tends to precede turning points in the official releases, effectively acting as a leading indicator both on the way up and on the way down. As a result, over the next weeks and months, we will be looking at this data to help understand where things may be headed.
May day
As mentioned above, the true litmus test over the next month will be whether payroll cuts have spilled over into additional sectors of the economy beyond leisure and hospitality. If that ends up being the case, it’s quite possible that markets will retest lows, as the economy will require more than a simple shot of adrenaline to put things back on course. For the time being, however, it appears the fallout has been somewhat isolated, which explains the recent positive momentum of the markets.


