

 Print
Print After a massive surge in homebuying throughout the pandemic, cracks are starting to show. Demand has begun to wane, while supply is increasing at the fastest pace in decades. So, will we see a moderation in prices if supply continues to outpace demand in the latter half of the year and into 2023?
To find out, let’s take a closer look at where things stand—and where they’re likely to go in the months and quarters ahead.
Housing Affordability Declines to Multi-Decade Low
The demand surge that occurred throughout the pandemic caused housing prices to rise at the fastest pace on record (greater than the period leading up to the great financial crisis). As prices rose, housing affordability declined slightly. Still, all-time-low mortgage rates helped keep buyers in the market, with higher prices offset by lower financing costs.
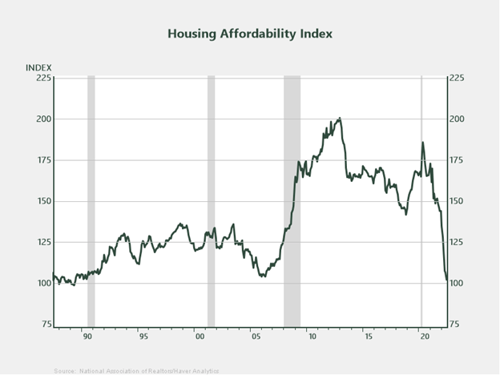
But that all changed in the early days of 2022 when the average 30-year mortgage rate doubled from 3 percent to 6 percent in a matter of months. Affordability fell precipitously, and a large cohort of homebuyers was simply priced out of the market. The effect is taking a toll on demand and sales.
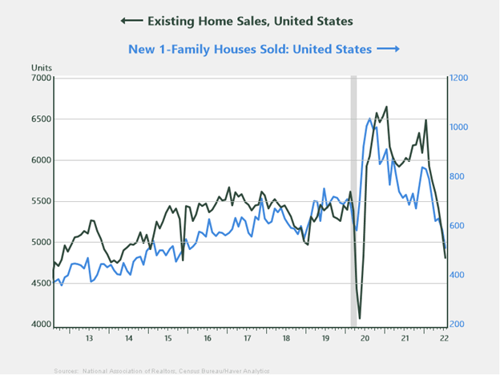
Home Sales Dip, Supply Surges
The effects of record-level prices and financing costs are playing out as expected, as evidenced by the significant decline in new and existing home sales in recent months. On a year-over-year basis, new and existing home sales are down 30 percent and 20 percent, respectively—some of the largest declines on record.
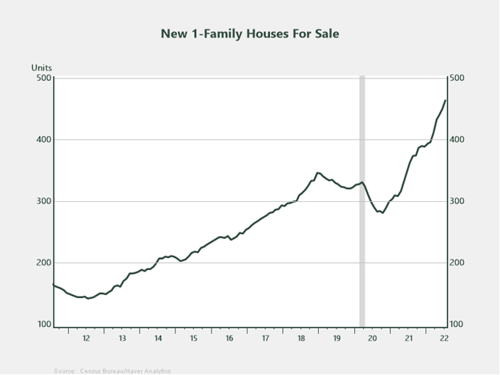
As demand wanes, supply continues to increase, particularly in the new home market as builders rush to bring inventory online before the housing downturn takes full form. New one-family homes for sale are up 28 percent year-over-year, a level greater than anything seen during the housing bubble of the mid-2000s.
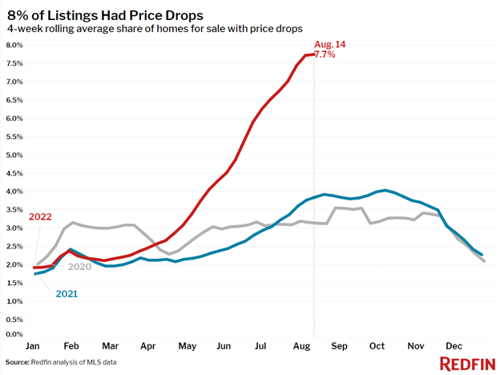
In response to the fallout in demand, many sellers are reducing listing prices. In fact, 8 percent of listings experienced a price drop in the four weeks prior to August 14. (In pandemic hotbed areas like Boise, Idaho, and Austin, Texas, 17 percent and 12 percent of listings, respectively, have seen price drops.)
For those sellers who do find a potential buyer in this market, it’s not a done deal until the ink is dry. According to Florida-based Redfin agent Heather Kruayai, “Homes are sitting on the market longer now, so buyers realize they have more options and more room to negotiate. They’re asking for repairs, concessions and contingencies, and if sellers say no, they’re backing out and moving on because they’re confident they can find something better.” In July, 16.1 percent of home-purchase agreements that went under contract that month fell through, for a total of 63,000 canceled deals, according to Redfin.
Where Do Housing Prices Go Next?
One of the best metrics for assessing the direction of housing prices is the Demand-Supply Ratio. This index, designed internally by Commonwealth’s Investment Management team, divides homes sales (demand) by homes for sale (supply) on a monthly basis. Currently, supply is greatly outpacing demand, as evidenced by the decline in the blue line in the chart below, suggesting that housing prices (green) are likely to move lower in the months ahead. (In any market, if demand lags supply in a significant way, prices adjust. Housing is no different.) While the past few years have certainly been a sellers’ market, the next few years are likely to swing in the favor of buyers.
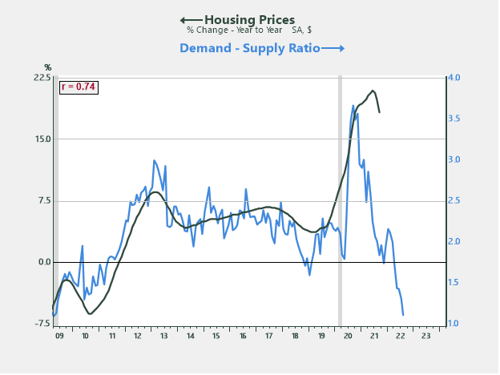
Source: Commonwealth
Housing Is a Barometer for the Economy
Housing accounts for roughly 4 percent of GDP. The multiplier effect, however, is a magnitude beyond this figure because of the number of businesses that are generally involved with a home purchase. These include realtors, home inspectors, and builders, all of whom benefit from the home purchase market. In addition, a new home generally requires some level of furnishing, which helps electronics, furniture, and appliance stores. In other words, negative developments in housing throughout the coming year will have a ripple effect on many tangential areas, thereby posing a headwind for the economy.
When trying to determine the overall health of the domestic economy, housing can serve as a useful barometer. Right now, it appears storm clouds are forming on the housing front—a yellow warning sign from an economic perspective.


